Fig. 13.
Download original image
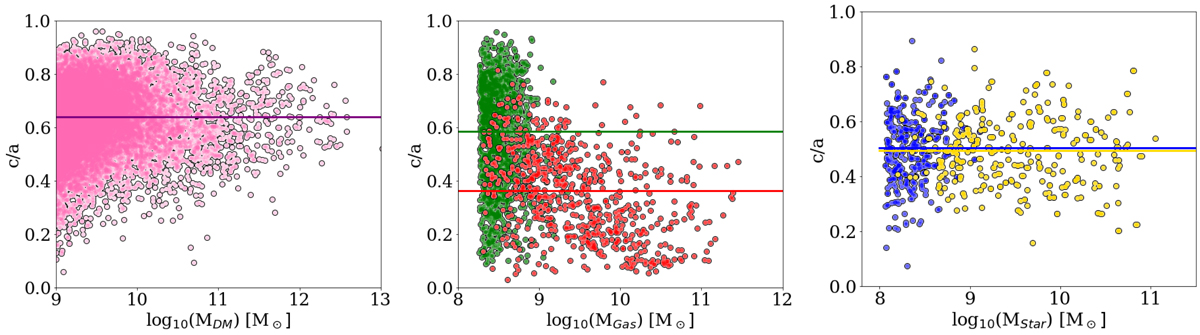
Analysis of 17 480 halos at z = 0.5 of RefL0025N0376 EAGLE simulation. The distribution of the sphericity, c/a, is shown as a function of the total mass of the halos for DM (left panel), gas (middle panel), and stars (right panel). Gas halos are split in two groups: gas halos w/o stars (1440) are in green and gas halos w/ stars (682) are in red. Star halos are split into two groups of approximately equal size: low-mass halos (Mtot < 1011 M⊙), depicted by blue dots, and high-mass halos (Mtot > 1011 M⊙), depicted by yellow dots. Colour lines represent the median.
Current usage metrics show cumulative count of Article Views (full-text article views including HTML views, PDF and ePub downloads, according to the available data) and Abstracts Views on Vision4Press platform.
Data correspond to usage on the plateform after 2015. The current usage metrics is available 48-96 hours after online publication and is updated daily on week days.
Initial download of the metrics may take a while.