Open Access
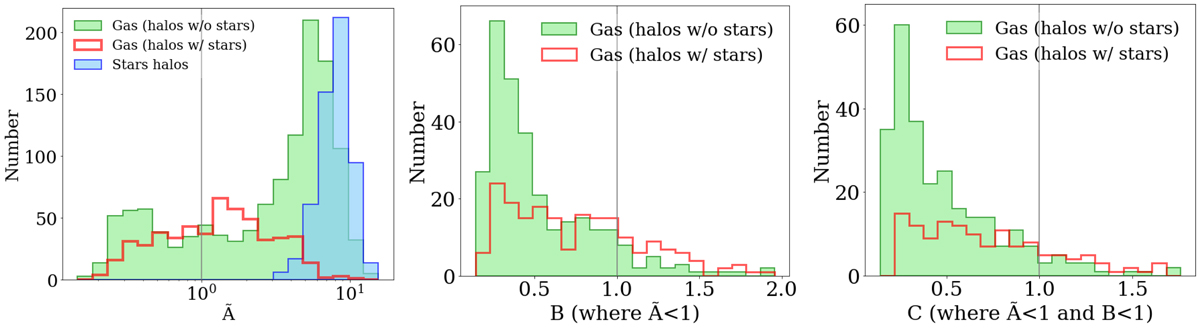
Fig. 11.
Download original image
Axis ratios ![]() ,
, ![]() and
and ![]() . Each panel corresponds to a sub-distribution. Left panel:
. Each panel corresponds to a sub-distribution. Left panel: ![]() (green and red bins) and
(green and red bins) and ![]() (blue bins) axis ratios. Values below 1 correspond to a semi-axis of gas (stars) larger than their DM equivalent. Middle panel:
(blue bins) axis ratios. Values below 1 correspond to a semi-axis of gas (stars) larger than their DM equivalent. Middle panel: ![]() distribution with only the
distribution with only the ![]() halos. Bottom panel:
halos. Bottom panel: ![]() distribution with only halos with
distribution with only halos with ![]() and
and ![]() .
.
Current usage metrics show cumulative count of Article Views (full-text article views including HTML views, PDF and ePub downloads, according to the available data) and Abstracts Views on Vision4Press platform.
Data correspond to usage on the plateform after 2015. The current usage metrics is available 48-96 hours after online publication and is updated daily on week days.
Initial download of the metrics may take a while.