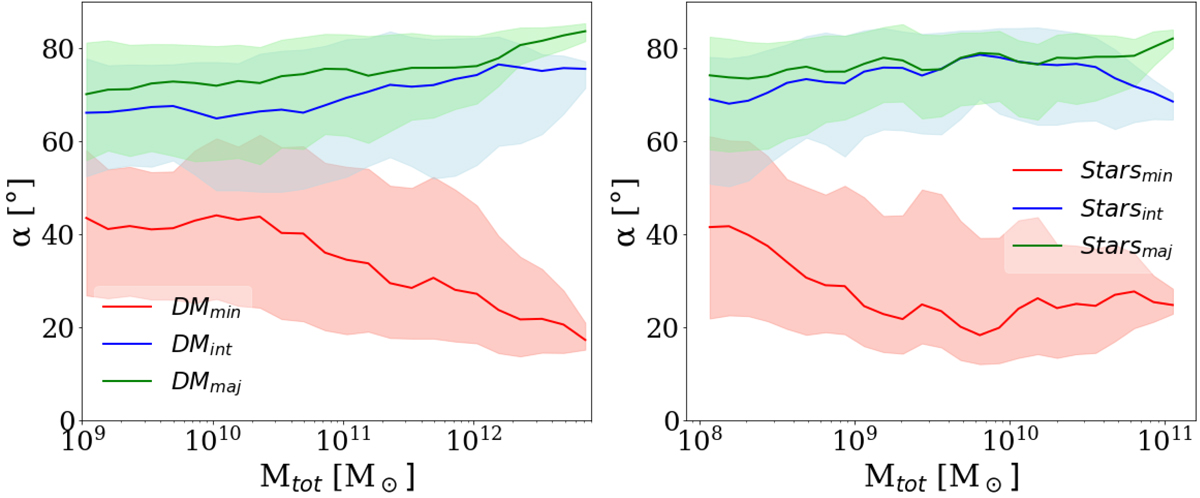
Fig. 10.
Download original image
Difference of alignment angle, α, between the minor axis of gas halos and all semi-axis of the DM (left panel) and star halos (right panel). The solid lines indicate the median values of α, whilst the shading denotes the 25th–75th quartiles. The values are shown as a function of the total mass (Mtot). The red, blue, and green curves correspond to the difference of alignment of the gas minor axis with respect to the minor, intermediate, and major axes, respectively.
Current usage metrics show cumulative count of Article Views (full-text article views including HTML views, PDF and ePub downloads, according to the available data) and Abstracts Views on Vision4Press platform.
Data correspond to usage on the plateform after 2015. The current usage metrics is available 48-96 hours after online publication and is updated daily on week days.
Initial download of the metrics may take a while.