Open Access
Fig. 6
Download original image
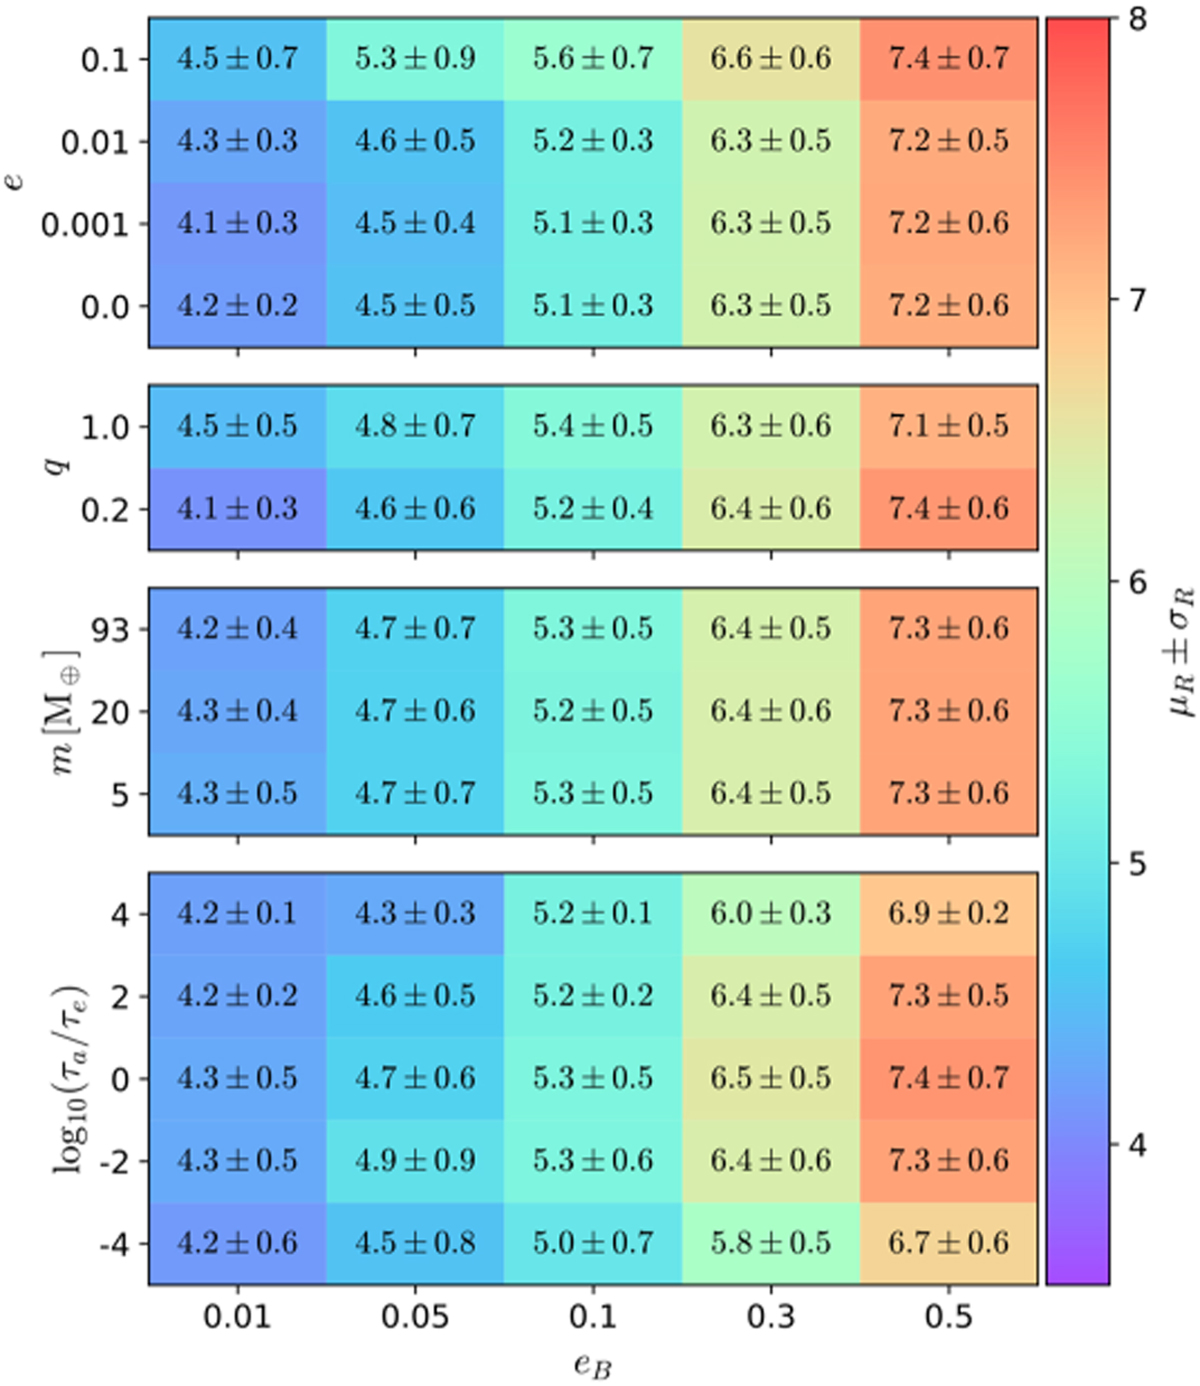
Average values of R obtained for simulations characterised by eB. The y-axis denotes the projection of all the simulations depending on e, q, m, and log10(τa/τe), from top to bottom panels, respectively.
Current usage metrics show cumulative count of Article Views (full-text article views including HTML views, PDF and ePub downloads, according to the available data) and Abstracts Views on Vision4Press platform.
Data correspond to usage on the plateform after 2015. The current usage metrics is available 48-96 hours after online publication and is updated daily on week days.
Initial download of the metrics may take a while.