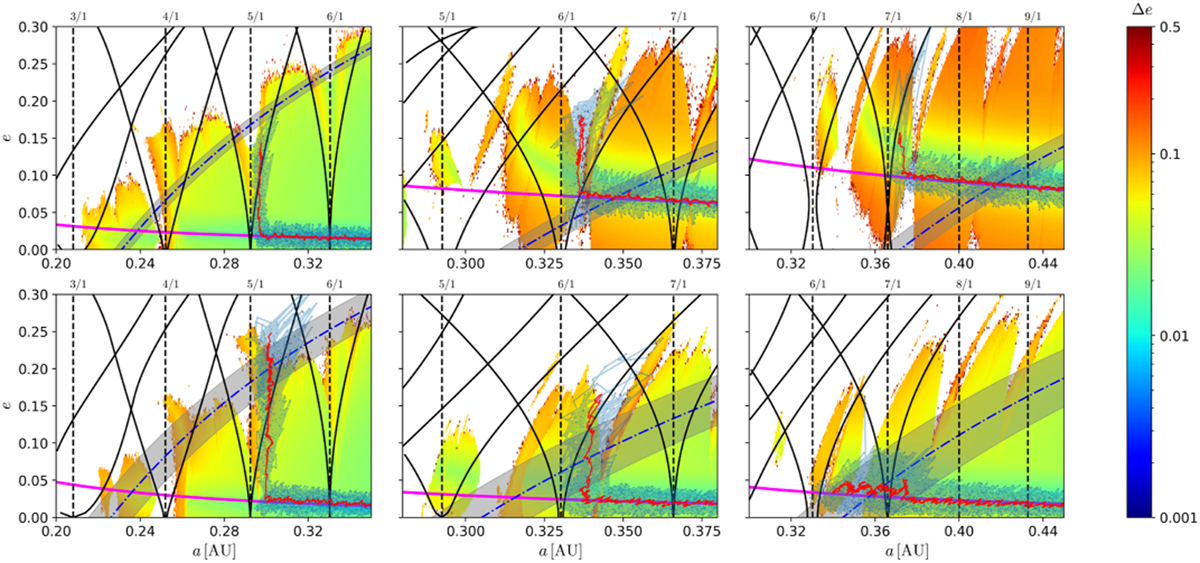
Fig. 3
Download original image
Dynamical maps in the plane (a, e), where each initial condition is integrated for 600 yr and the colour scale corresponds to the ∆e indicator. Solid black lines denote the width of the most prominent N/1 MMR and the dashed vertical lines indicate their nominal location, both calculated using Gallardo et al. (2021). For each of these maps, the binary has q = 0.2 (top frames) and q = 1 (bottom frames), and eB = 0.05 (left frames), eB = 0.3 (centre frames), and eB = 0.5 (right frames). The grey shaded area denotes the stability limit (the blue dot-dashed line being the reference value) calculated by Holman & Wiegert (1999), with its critical eccentricity approximated by Quarles et al. (2018). The solid magenta lines denote the approximation of the ‘capture’ mean eccentricity (Zoppetti et al. 2019). The light-blue dotted line denotes the simulated (a, e) evolution of a planet with m = 5 M⊕ and e = 0.01, setting τa = 105 yr and τe = 106 yr. The red solid line denotes the simple moving average of the planet trajectory, with a window of 20 points (dtw = 105 yr).
Current usage metrics show cumulative count of Article Views (full-text article views including HTML views, PDF and ePub downloads, according to the available data) and Abstracts Views on Vision4Press platform.
Data correspond to usage on the plateform after 2015. The current usage metrics is available 48-96 hours after online publication and is updated daily on week days.
Initial download of the metrics may take a while.