Fig. 1
Download original image
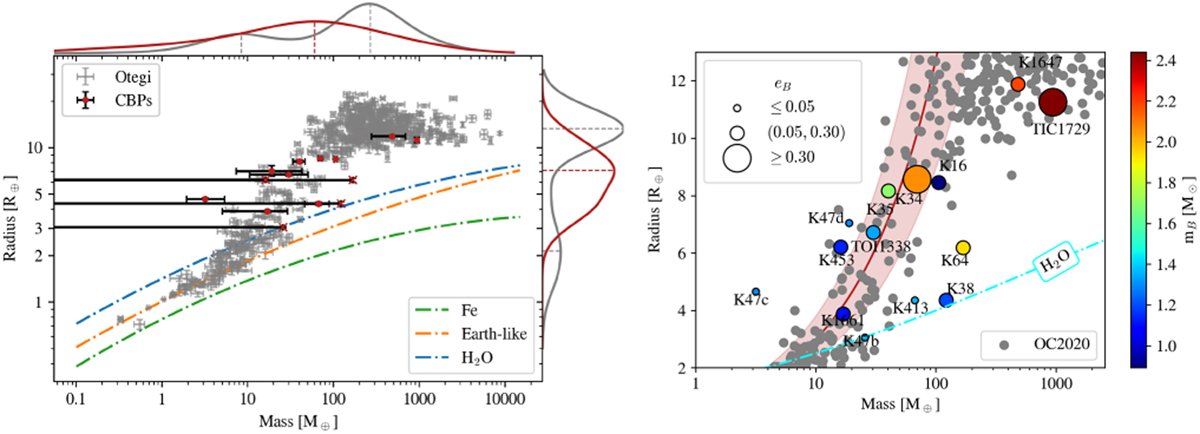
Mass–radius relation of transiting circumbinary exoplanets and circumstellar exoplanets. Left panel: radii of exoplanets presented in OC2020 (grey) and CBPs (red/black) as a function of their mass. Their respective error estimations are presented with error bars. In the case of K38, K47b, K413, and K453, we mark their maximum mass reference value with cross symbols (×). The light-blue, orange, and green lines denote the theoretical H2O, Fe, and Earth-like composition lines. The curves outside the box represent the kernel density estimation of the mass (top) and radius (right) of the scattered data points. The data bandwidth for density estimation is calculated with Scott’s Rule (Scott 2015) using the scipy Python package. The vertical (top) and horizontal (right) dashed lines denote the locations of the maximum values in each distribution. All distributions are normalised to their own total counts. Right panel: zoom onto the CBP region shown in the left panel. The exoplanets presented in OC2020 are shown as grey circles, while the CBPs are coloured according to their binary mass. The size of each CBP circle is proportional to the eccentricity of the binary. The red shaded area denotes the mass–radius relation (the red solid line being its reference values) presented in OC2020
Current usage metrics show cumulative count of Article Views (full-text article views including HTML views, PDF and ePub downloads, according to the available data) and Abstracts Views on Vision4Press platform.
Data correspond to usage on the plateform after 2015. The current usage metrics is available 48-96 hours after online publication and is updated daily on week days.
Initial download of the metrics may take a while.