Fig. 6.
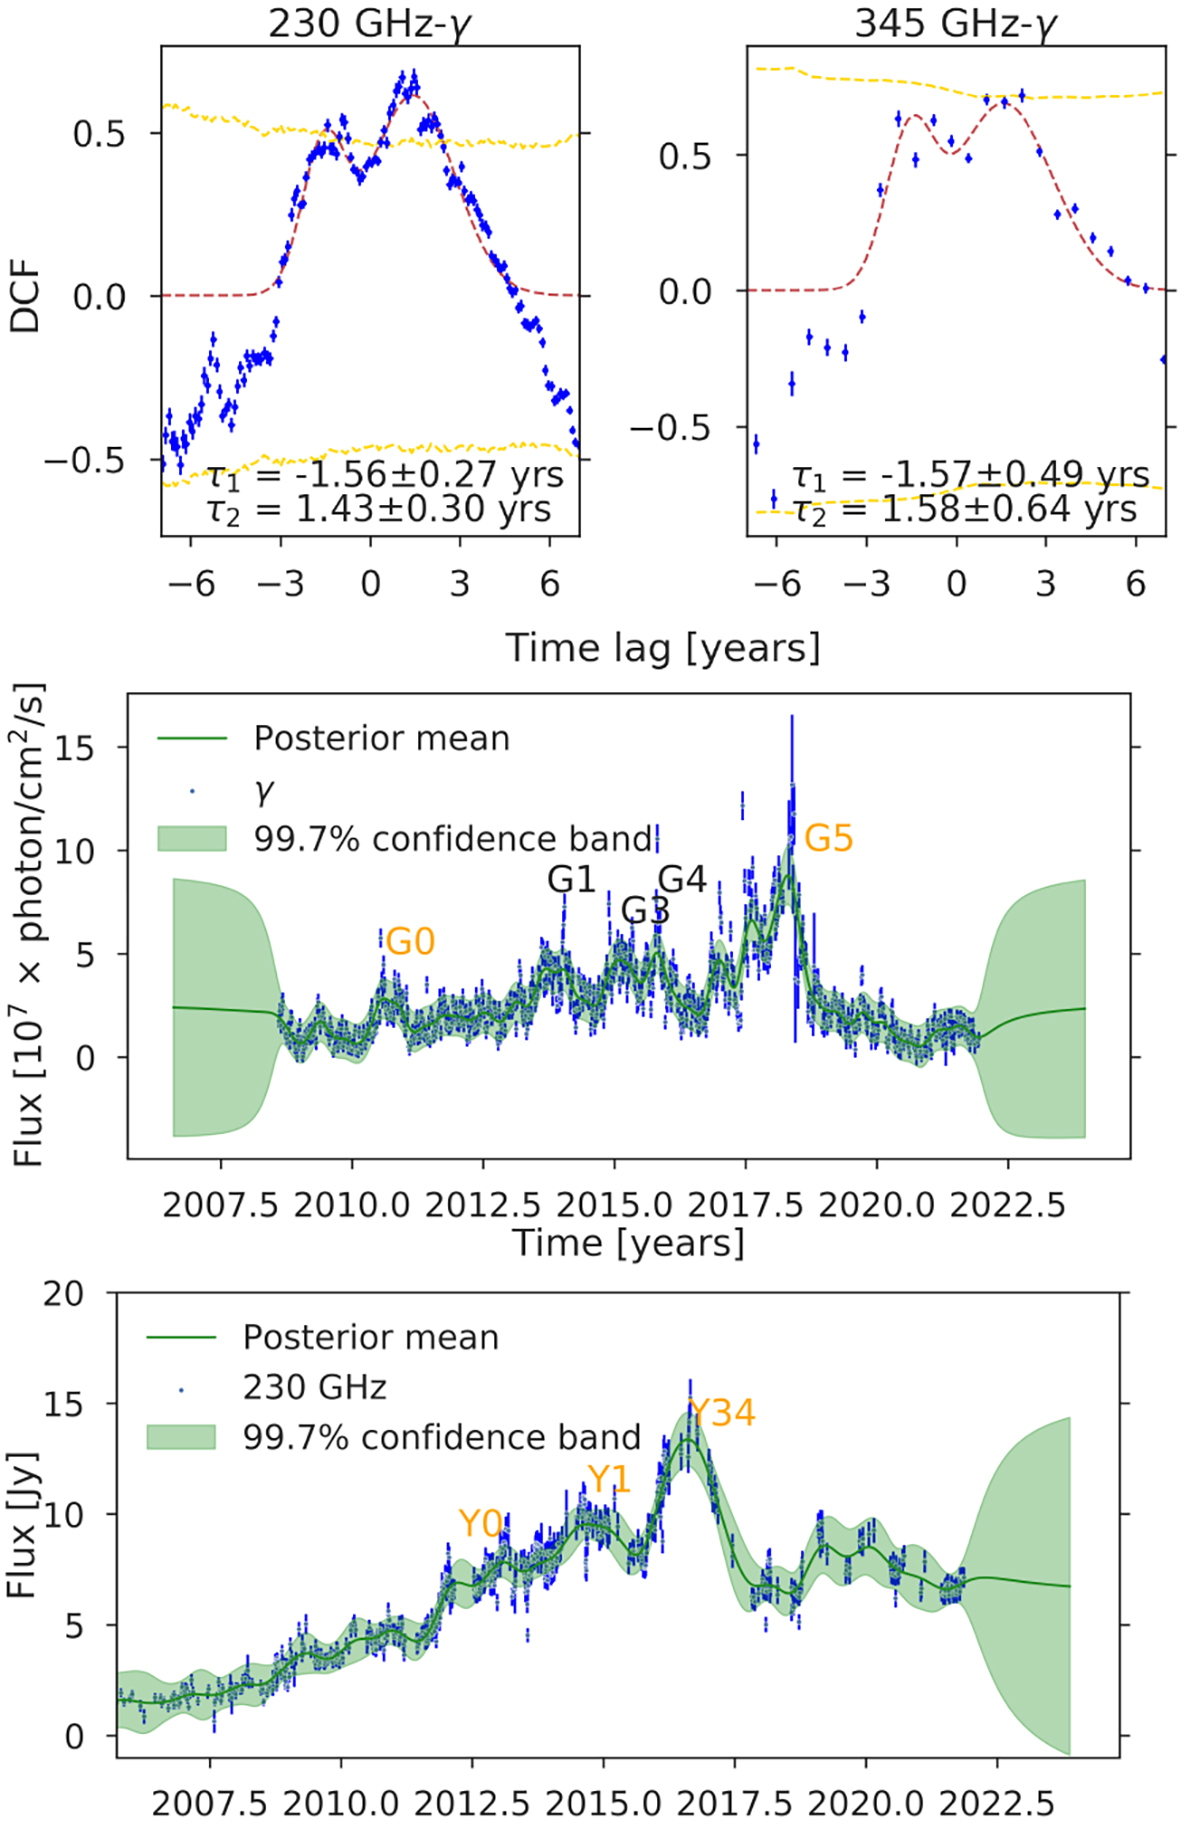
Download original image
Discrete cross-correlation function and GPR analyses of the γ-ray light curve. Top row: discrete cross-correlation function of γ-rays vs. 230 GHz (left) and 345 GHz (right) for 3C 84. The dashed red line corresponds to a double Gaussian fit of the DCF, the means of which (τ1 and τ2) are used as a more accurate estimate of the peak positions. The dashed gold curve again denotes the 99.7% confidence band. Middle row: curve for γ-ray emission in 3C 84. G1, G3, G4 (Hodgson et al. 2018), and G0, G5 denote the γ-ray flares considered in this work. Bottom row: Gaussian process regression curve for 230 GHz emission in 3C 84, matching the time range of the γ-rays. Y0, Y1, and Y34 denote the most prominent flares, which are possibly associated with the γ-ray ones.
Current usage metrics show cumulative count of Article Views (full-text article views including HTML views, PDF and ePub downloads, according to the available data) and Abstracts Views on Vision4Press platform.
Data correspond to usage on the plateform after 2015. The current usage metrics is available 48-96 hours after online publication and is updated daily on week days.
Initial download of the metrics may take a while.