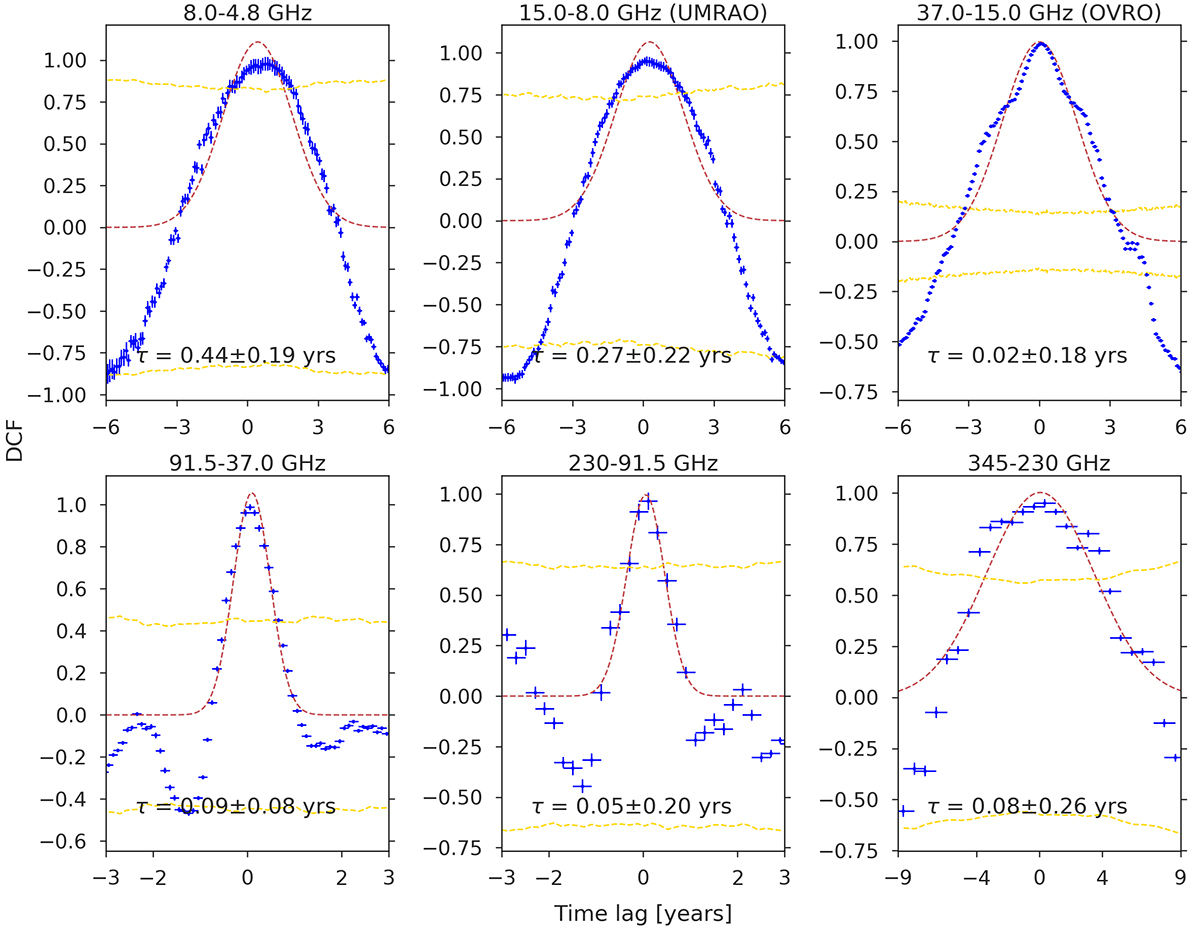
Fig. 4.
Download original image
Discrete cross-correlation function analysis curves. Top row: 8.0 GHz vs. 4.8 GHz, 15.0 GHz (UMRAO) vs. 8.0 GHz, and 37.0 GHz vs. 15.0 GHz (OVRO). Bottom row: 91.5 GHz vs. 37 GHz, 230 GHz versus 91.5 GHz, and 345 GHz vs. 230 GHz. The dashed red line corresponds to a Gaussian function fit of the DCF, the mean of which (τ) is used as a more accurate estimate of the peak position. The dashed gold curve denotes the 99.7% confidence band.
Current usage metrics show cumulative count of Article Views (full-text article views including HTML views, PDF and ePub downloads, according to the available data) and Abstracts Views on Vision4Press platform.
Data correspond to usage on the plateform after 2015. The current usage metrics is available 48-96 hours after online publication and is updated daily on week days.
Initial download of the metrics may take a while.