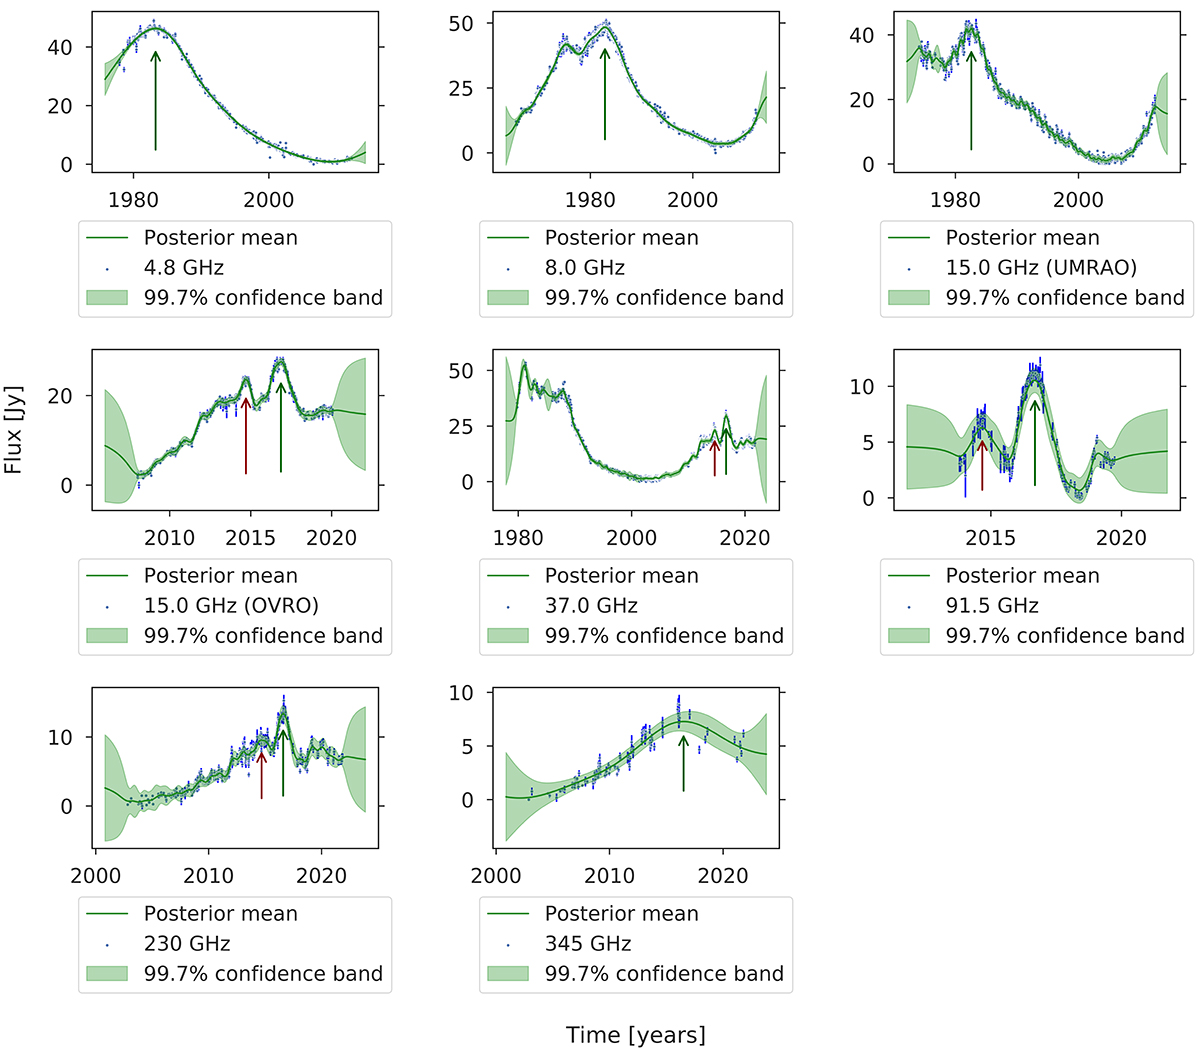
Fig. 3.
Download original image
Gaussian process regression curves of 3C 84, using the light curves presented in Fig. 1. The minimum flux density shown in Table A.1 has already been subtracted. The blue data points denote the observations, the green solid line denotes the posterior mean, and the light-green envelope shows the 99.7% confidence bands. The dark-green arrow denotes the primary flare per frequency used for the time-lag calculation, and the dark-red arrow the secondary flare, wherever it was detectable.
Current usage metrics show cumulative count of Article Views (full-text article views including HTML views, PDF and ePub downloads, according to the available data) and Abstracts Views on Vision4Press platform.
Data correspond to usage on the plateform after 2015. The current usage metrics is available 48-96 hours after online publication and is updated daily on week days.
Initial download of the metrics may take a while.