Fig. 1.
Download original image
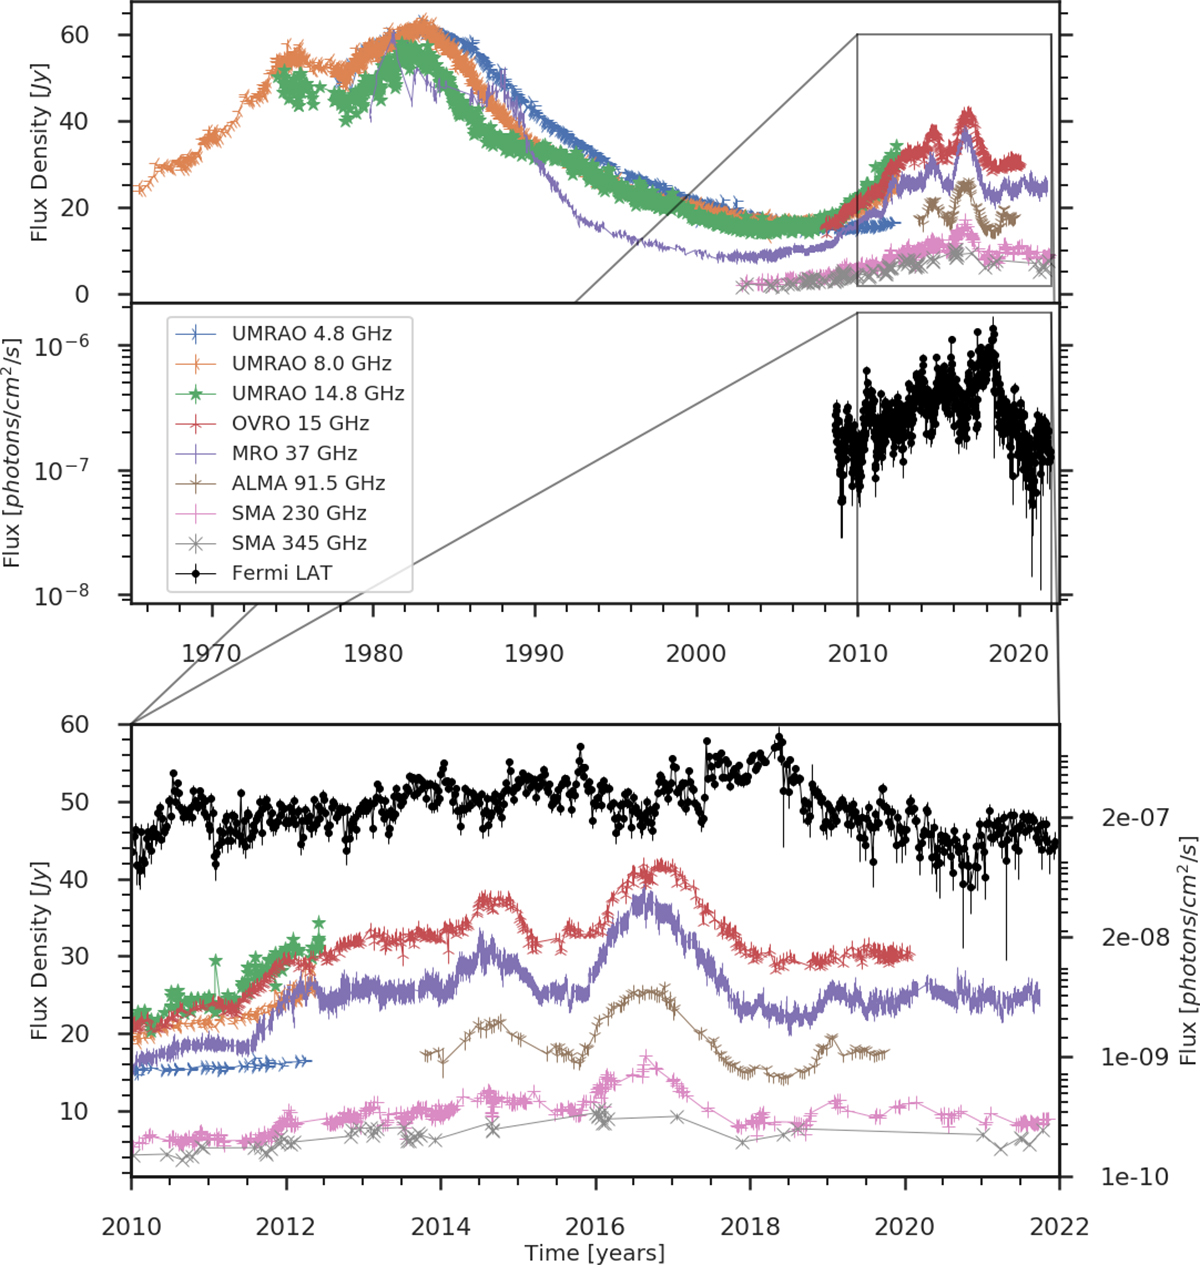
Variability light curves of 3C 84. Top: radio light curves of 3C 84, between 1965 and 2022, at 4.8, 8.0, 14.8, 15, 37, 230, and 345 GHz (coloured entries, in order of appearance in the figure caption). Middle: black data set shows the γ-ray flux. Bottom: zoomed-in view of the top two panels to facilitate the comparison of flare onsets and decays in the time range 2010–2022.
Current usage metrics show cumulative count of Article Views (full-text article views including HTML views, PDF and ePub downloads, according to the available data) and Abstracts Views on Vision4Press platform.
Data correspond to usage on the plateform after 2015. The current usage metrics is available 48-96 hours after online publication and is updated daily on week days.
Initial download of the metrics may take a while.