Fig. 6.
Download original image
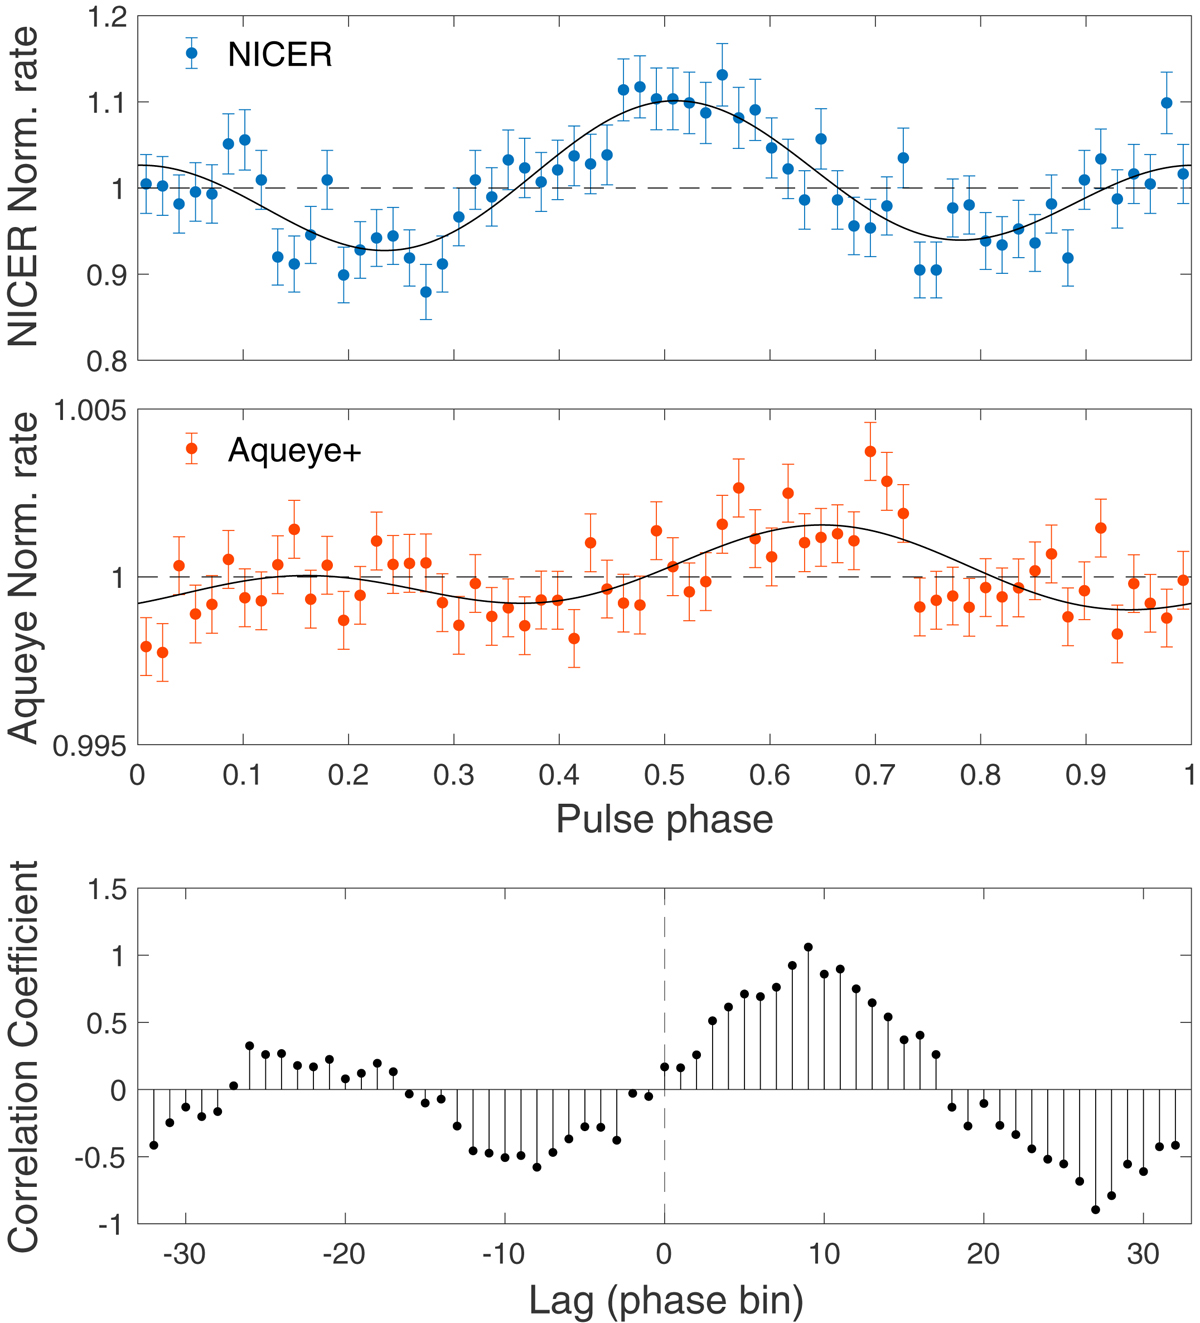
Cross-correlation of the pulse profiles from NICER and Aqueye+ observations of February 2019 as the lag varies. The top and middle panels show NICER and Aqueye+ pulse profiles with 64 phase bins, respectively. Solid lines indicate the best-fitting two-harmonic function. The bottom panel shows the cross-correlation coefficient as a function of the lag with which the optical pulse profile is shifted. We used phase lags ranging from −32 to +32, including the zero lag (dashed vertical line).
Current usage metrics show cumulative count of Article Views (full-text article views including HTML views, PDF and ePub downloads, according to the available data) and Abstracts Views on Vision4Press platform.
Data correspond to usage on the plateform after 2015. The current usage metrics is available 48-96 hours after online publication and is updated daily on week days.
Initial download of the metrics may take a while.