Fig. 5.
Download original image
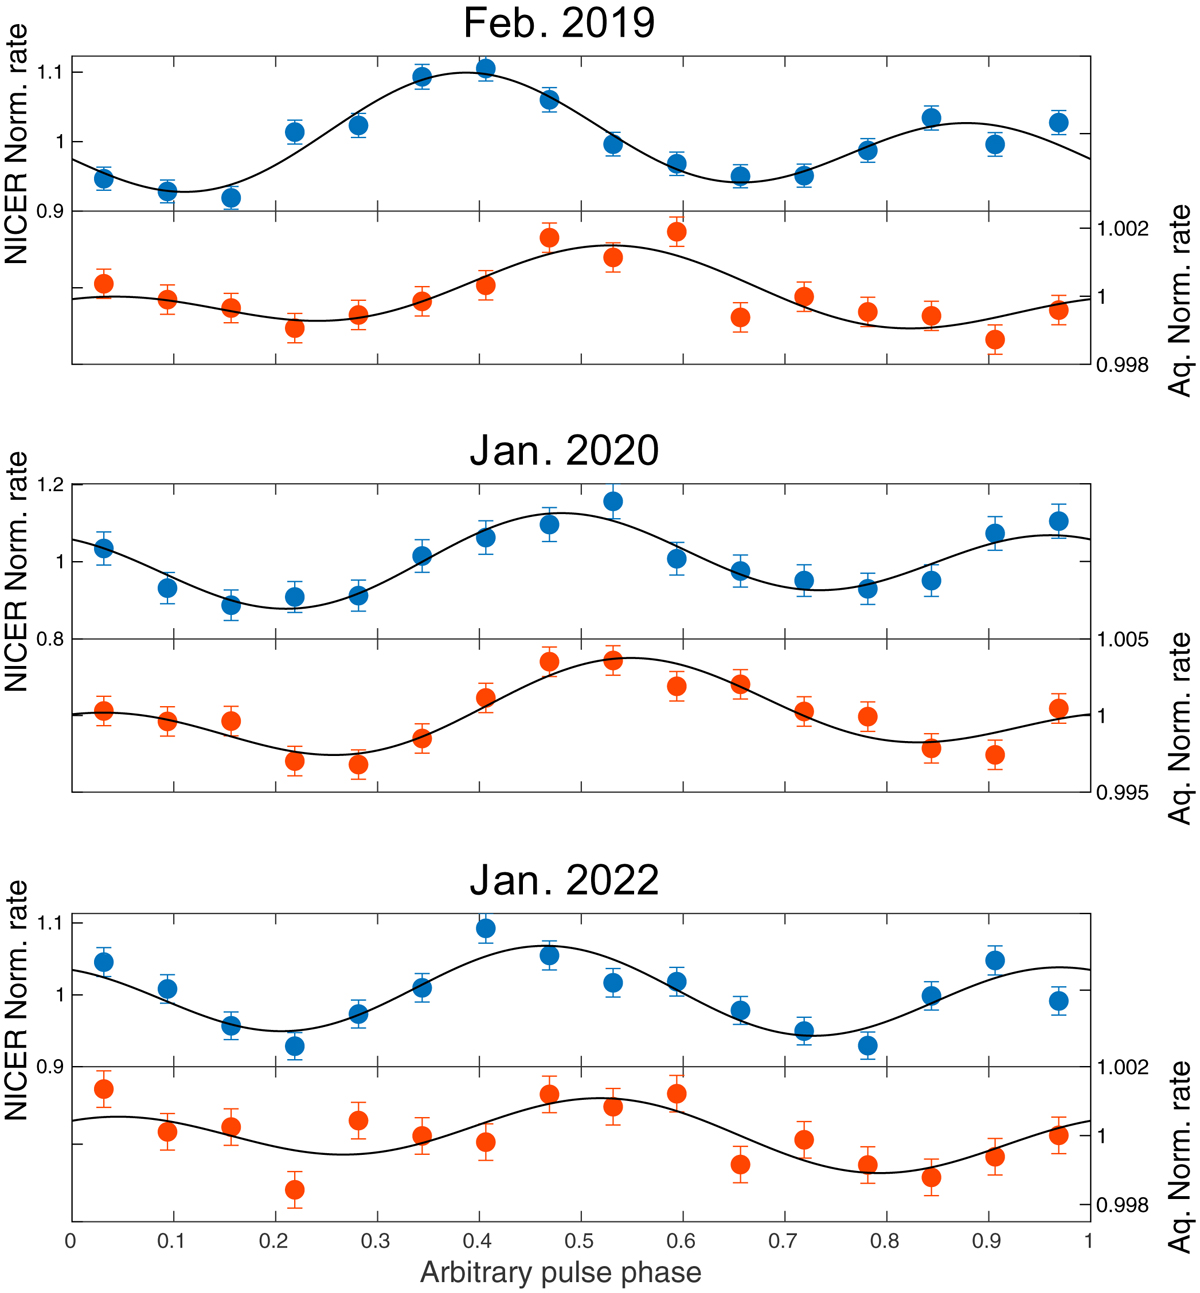
Pulse profiles obtained by folding with 16 phase bins of simultaneous observations with NICER (blue points, left y-axis scale) and Aqueye+ (red points, right y-axis scale) in February 2019 (top panel), January 2020 (middle panel), and January 2022 (bottom panel). Solid lines indicate the best-fitting two-harmonic functions. The zero of the pulse phase was shifted arbitrarily in each panel by the same amount for both instruments.
Current usage metrics show cumulative count of Article Views (full-text article views including HTML views, PDF and ePub downloads, according to the available data) and Abstracts Views on Vision4Press platform.
Data correspond to usage on the plateform after 2015. The current usage metrics is available 48-96 hours after online publication and is updated daily on week days.
Initial download of the metrics may take a while.