Fig. 4.
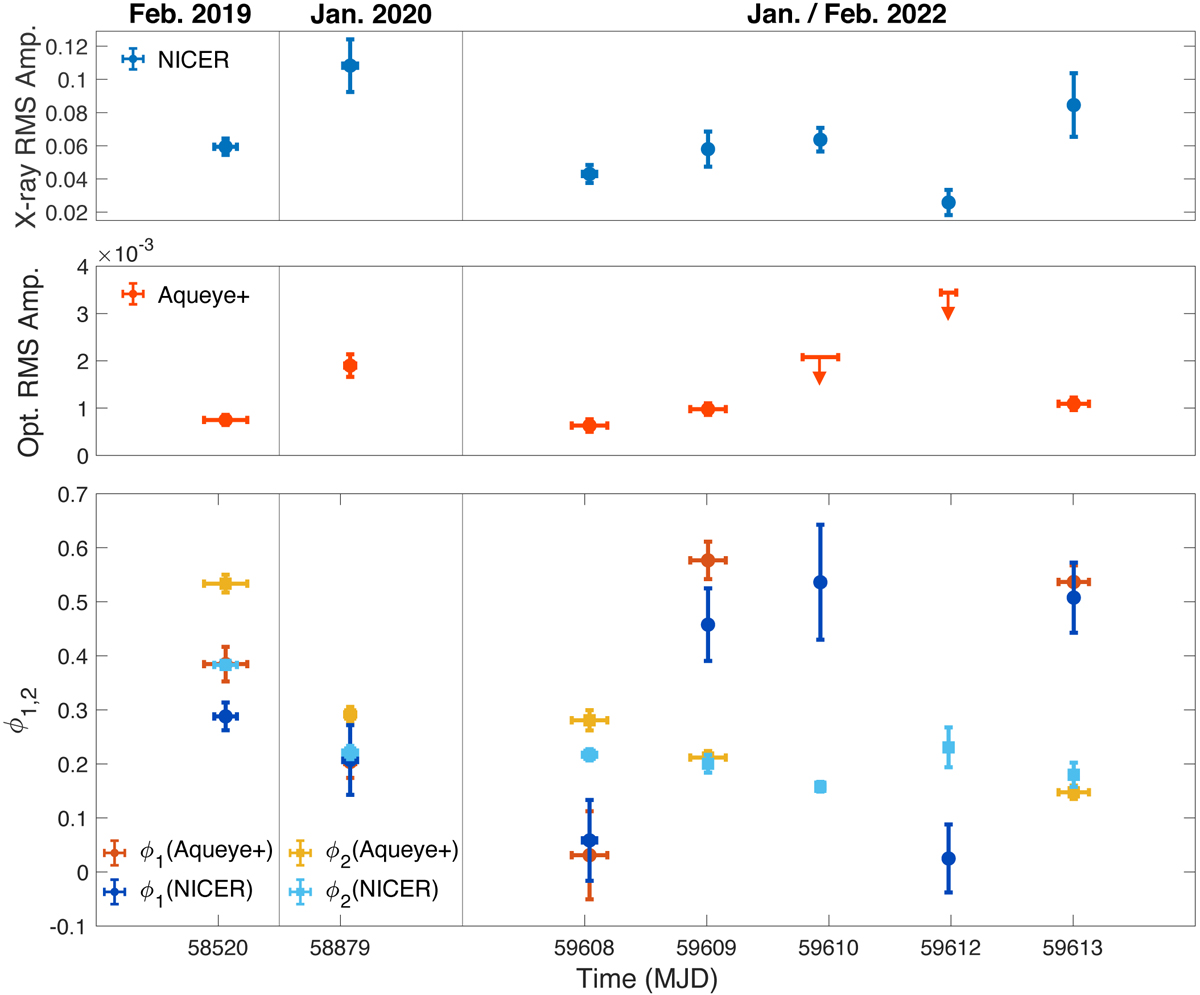
Download original image
Background-subtracted rms amplitudes of X-ray (top panel) and optical (middle panel) pulse during NICER/Aqueye+ simultaneous observations in February 2019, January 2020, and January–February 2022. The arrows represent the upper limits converted into rms amplitudes at 3σ confidence level computed when the optical pulsations were not detected. In the lower panel, we show the phases of the optical pulse (red dots and empty yellow squares show the first and second harmonic, respectively), and the phases of the X-ray pulse (blue dots and light blue empty squares show the first and second harmonic, respectively) during these simultaneous observations.
Current usage metrics show cumulative count of Article Views (full-text article views including HTML views, PDF and ePub downloads, according to the available data) and Abstracts Views on Vision4Press platform.
Data correspond to usage on the plateform after 2015. The current usage metrics is available 48-96 hours after online publication and is updated daily on week days.
Initial download of the metrics may take a while.