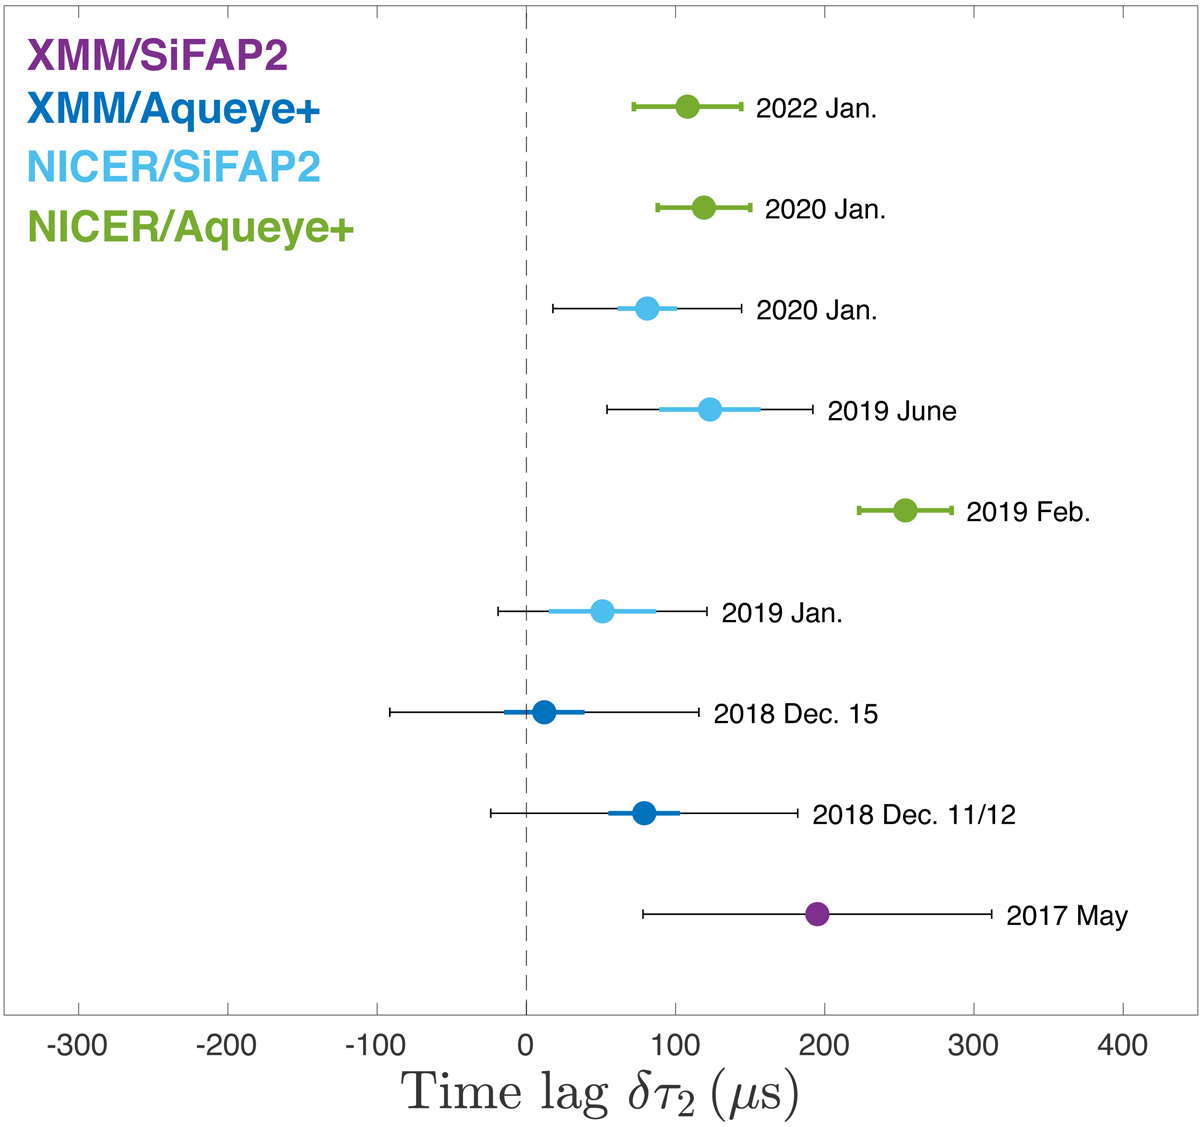
Fig. 3.
Download original image
Time lags relative to the second harmonic term (Table 5). The y-axis is not temporally equispaced. The purple point indicates the values for simultaneous observations between XMM-Newton and SiFAP2, blue points show values between XMM-Newton and Aqueye+, light blue points indicate values between NICER and SiFAP2, and green points show the values between NICER and Aqueye+. The dashed line indicates a zero time lag. Colored error bars represent 1σ statistical uncertainties, while the black error bars indicate the total error. The influence of the absolute timing accuracy of XMM-Newton (∼100 μs) and SiFAP2 (∼60 μs) is visible.
Current usage metrics show cumulative count of Article Views (full-text article views including HTML views, PDF and ePub downloads, according to the available data) and Abstracts Views on Vision4Press platform.
Data correspond to usage on the plateform after 2015. The current usage metrics is available 48-96 hours after online publication and is updated daily on week days.
Initial download of the metrics may take a while.