Fig. 1.
Download original image
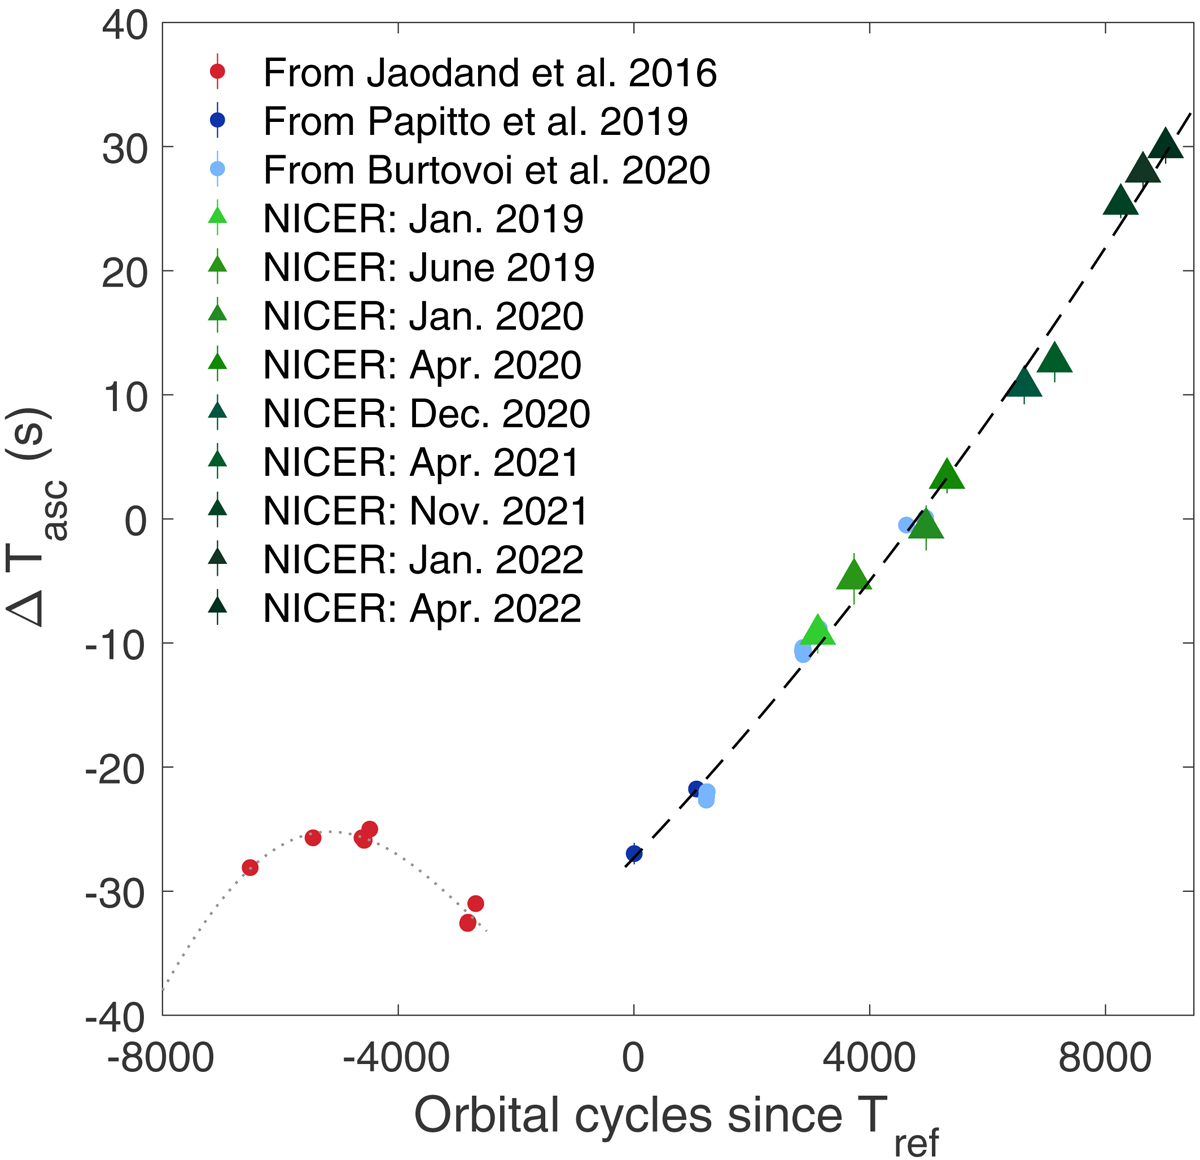
Long-term evolution of Tasc as a function of the number of orbital cycles since Tref = 57897.027668 MJD. Red points are the values found by Jaodand et al. (2016), which deviate from the almost linearly increasing trend found in this work. Blue points are from Papitto et al. (2019), and lighter blue points are from Burtovoi et al. (2020). Triangles, associated in the legend with the different NICER observations, are from this work. The thick dashed line indicates our increasing roughly linear trend. The dotted gray line indicates the sinusoidal trend that is similar to the trend found in previous work (e.g., Jaodand et al. 2016; Papitto et al. 2019).
Current usage metrics show cumulative count of Article Views (full-text article views including HTML views, PDF and ePub downloads, according to the available data) and Abstracts Views on Vision4Press platform.
Data correspond to usage on the plateform after 2015. The current usage metrics is available 48-96 hours after online publication and is updated daily on week days.
Initial download of the metrics may take a while.