Fig. 2.
Download original image
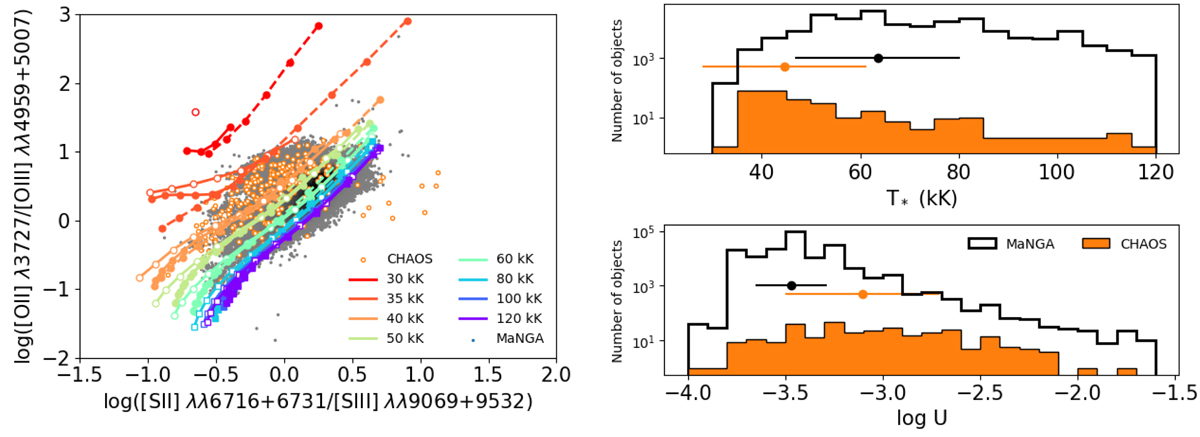
Softness diagram and effective temperature and ionization parameter distributions in our samples. Left panel: softness diagram representing [O II]/[O III] vs. [S II]/[S III] for the selected regions in CHAOS and MaNGA as compared with different model sequences calculated using WM-Basic atmospheres for T* between 30 and 60 kK (represented with circles), and Rauch for T* between 80 and 120 kK (represented with squares). Solid lines represent models with 12 + log(O/H) = 8.9, and dashed lines 12 + log(O/H) = 8.0. Filled symbols represent models calculated assuming spherical geometry while empty symbols represent models with plane-parallel geometry (only for O/H = 8.9 in this case). Right panel: distributions of the derived properties using HCM-TEFF (upper panel: T*, lower panel: log U) using as input the metallicity and the emission line-ratios represented in the left panel. The empty histograms represent the MaNGA sample and the orange ones the CHAOS sample. The median and standard deviations are represented in all panels in the same colors.
Current usage metrics show cumulative count of Article Views (full-text article views including HTML views, PDF and ePub downloads, according to the available data) and Abstracts Views on Vision4Press platform.
Data correspond to usage on the plateform after 2015. The current usage metrics is available 48-96 hours after online publication and is updated daily on week days.
Initial download of the metrics may take a while.