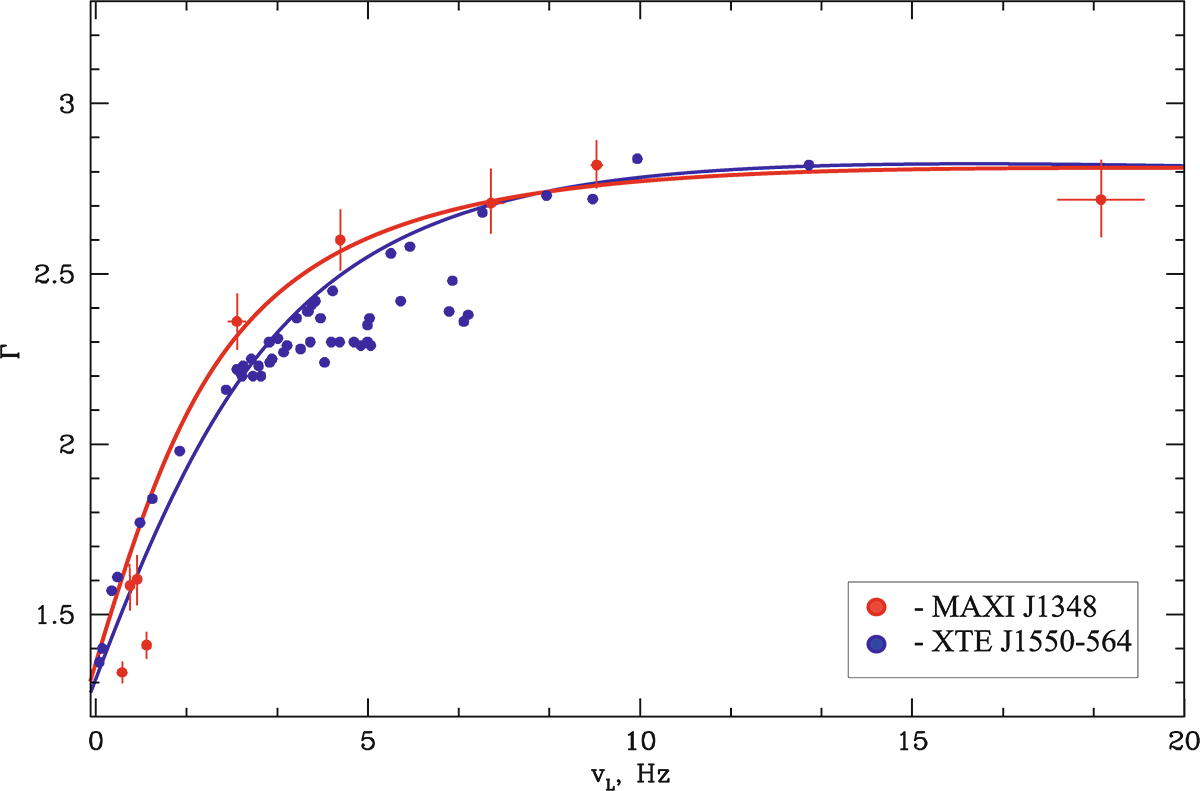
Fig. 7.
Download original image
Photon index, Γ, vs. the QPO frequency, νL, for MAXI J1348–630 (target source) and XTE J1550–564 (reference source). We use a specific function f(ν), detailed in Eq. (3) of Sect. 3.2.1, to fit the data, which gives us the corresponding solid lines. We can see that Γ is correlated with νL and saturated for νL > 6.8 Hz and νL > 10 Hz for MAXI J1348–630 and XTE J1550–564, respectively. Data for XTE J1550–564 were taken from ST09.
Current usage metrics show cumulative count of Article Views (full-text article views including HTML views, PDF and ePub downloads, according to the available data) and Abstracts Views on Vision4Press platform.
Data correspond to usage on the plateform after 2015. The current usage metrics is available 48-96 hours after online publication and is updated daily on week days.
Initial download of the metrics may take a while.