Fig. 6.
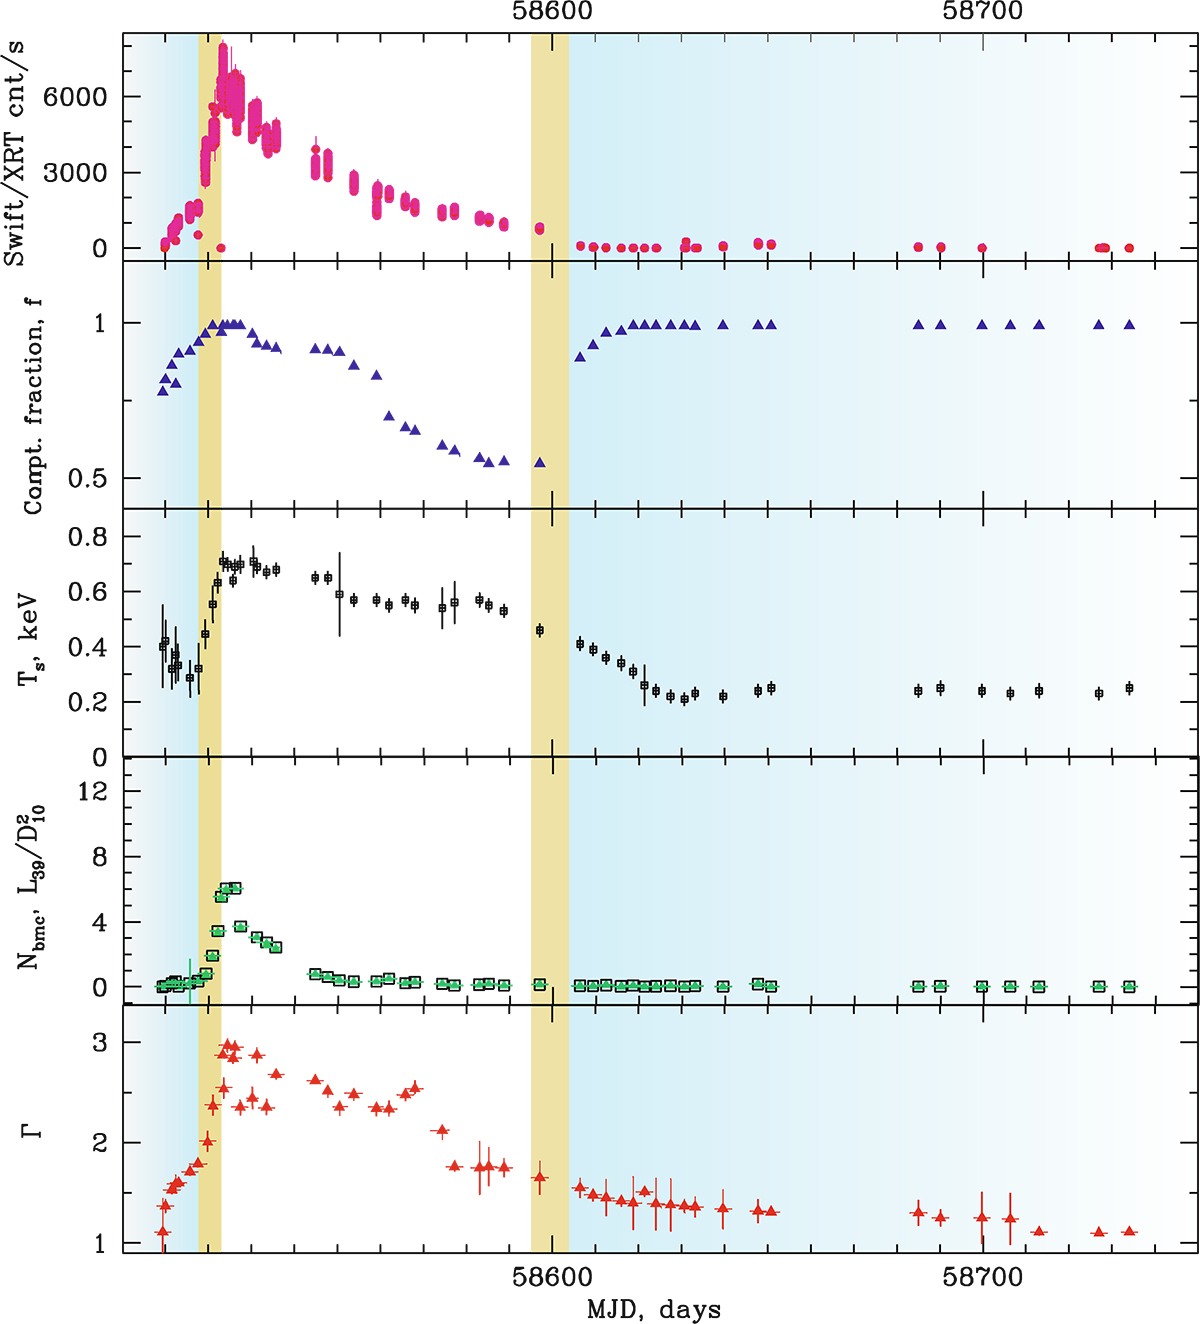
Download original image
Temporal evolution of the Swift/XTE count rate (pink) from the LHS to the HSS and back, shown from top to bottom. Comptonized fraction f (blue), seed photon temperature Ts (black), Nbmc (green) and Γ (red) during the MJD = 58509–58734 outburst transition set. We note that the Comptonized fraction f = A/(A + 1) characterizes the fraction of the soft photons illuminating the Compton cloud (CC), and subsequently up-scattered in the CC hot plasma. Vertical bright blue, hazel and white strips indicates the LHS, IS, and HSS spectral states, correspondingly (as in Fig. 3).
Current usage metrics show cumulative count of Article Views (full-text article views including HTML views, PDF and ePub downloads, according to the available data) and Abstracts Views on Vision4Press platform.
Data correspond to usage on the plateform after 2015. The current usage metrics is available 48-96 hours after online publication and is updated daily on week days.
Initial download of the metrics may take a while.