Fig. 3.
Download original image
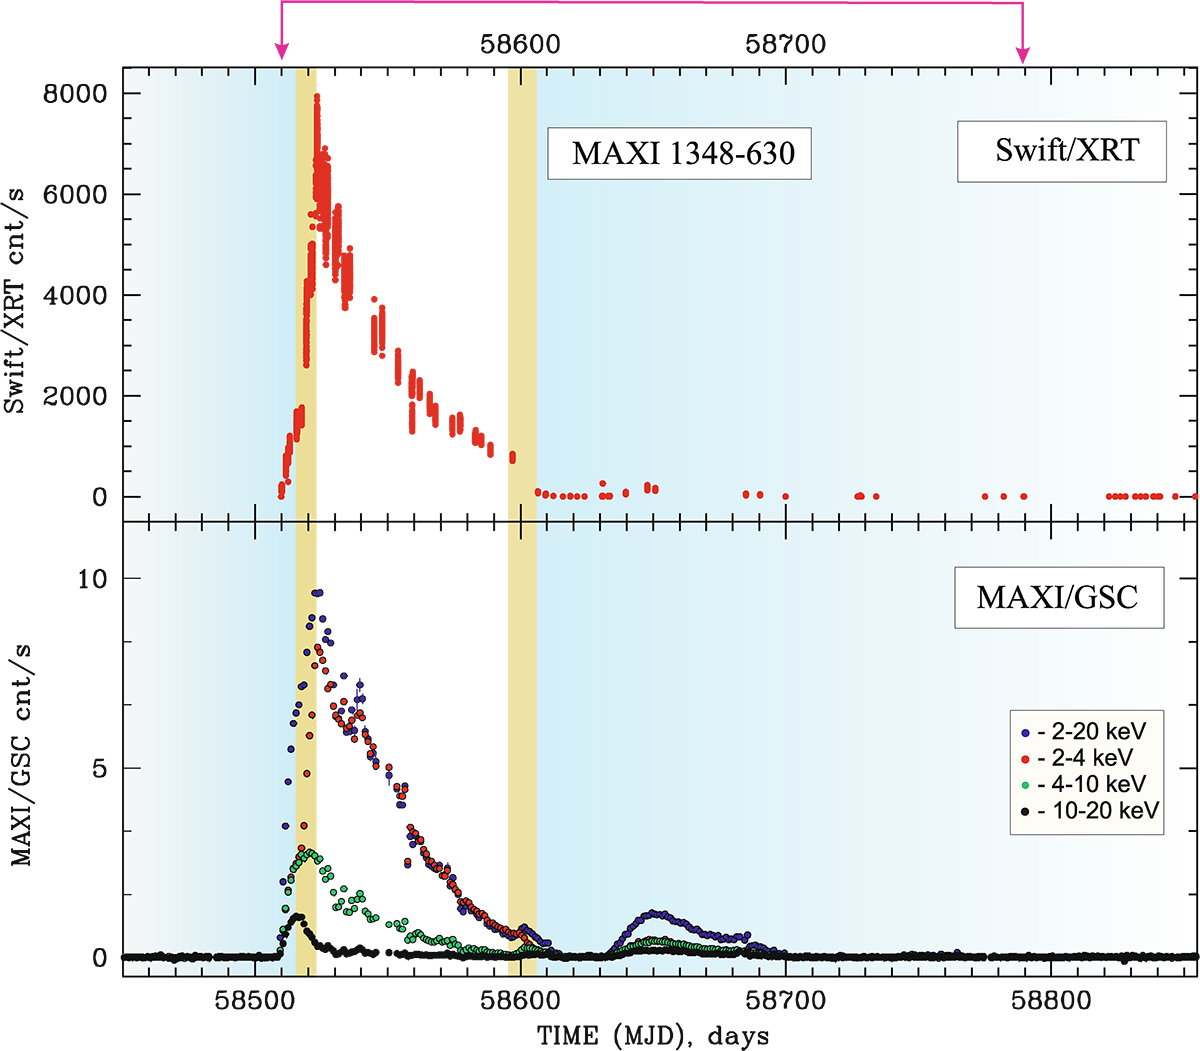
Evolution of Swift/XRT (0.3–10 keV, top panel) and MAXI/GSC flux (bottom panel) in 2–20 keV, 2–4 keV, 4–10 keV and 10–20 keV energy ranges during 58450–58800 MJD observations of MAXI J1348–630. Vertical bright blue, hazel, and white strips indicates the LHS, IS and HSS spectral states, correspondingly (for identification of spectral states see Sect. 3.1). Pink arrow (at top of the panel) indicate the time interval under our study (from January to September, 2019) for data sets listed in Table 2.
Current usage metrics show cumulative count of Article Views (full-text article views including HTML views, PDF and ePub downloads, according to the available data) and Abstracts Views on Vision4Press platform.
Data correspond to usage on the plateform after 2015. The current usage metrics is available 48-96 hours after online publication and is updated daily on week days.
Initial download of the metrics may take a while.