Fig. 9.
Download original image
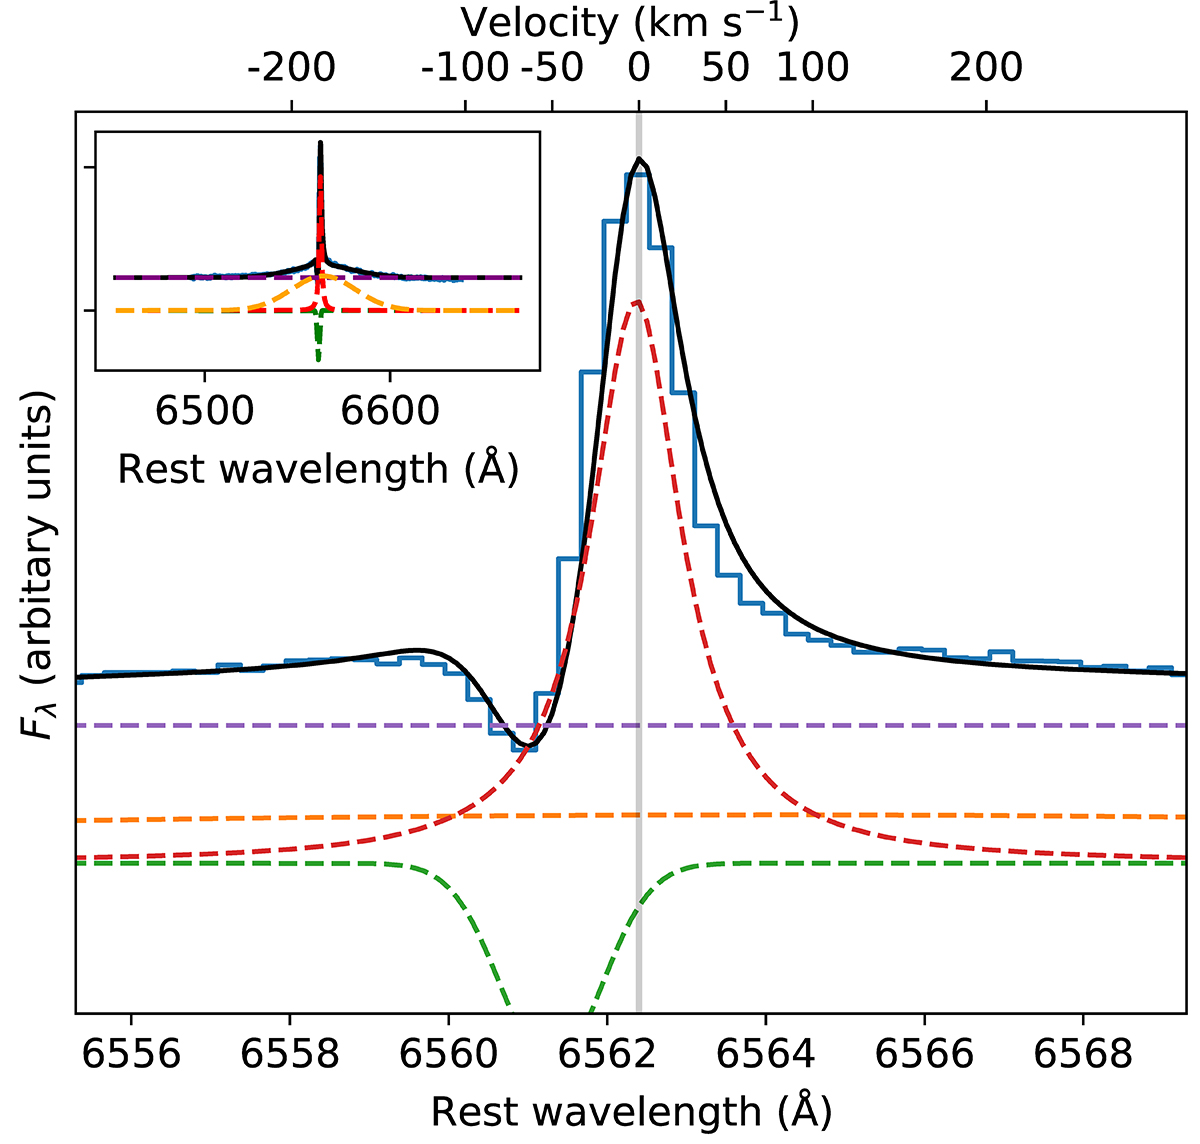
Fitting the +88 d Hα profile taken with the medium-resolution NOT Gr#17 spectrum (blue). Dashed lines show the individual components: the orange and green lines are Gaussian fits to the broad component and absorption trough, respectively; the red is a Lorentzian profile fit to the narrow emission component, and the purple line represents the underlying continuum. The solid black line shows the composite fit. The inset shows a wider wavelength range revealing the broad wings in Hα. The orange component in the inset has been multiplied by a factor of 3 to more clearly demonstrate its shape. The vertical line marks zero velocity.
Current usage metrics show cumulative count of Article Views (full-text article views including HTML views, PDF and ePub downloads, according to the available data) and Abstracts Views on Vision4Press platform.
Data correspond to usage on the plateform after 2015. The current usage metrics is available 48-96 hours after online publication and is updated daily on week days.
Initial download of the metrics may take a while.