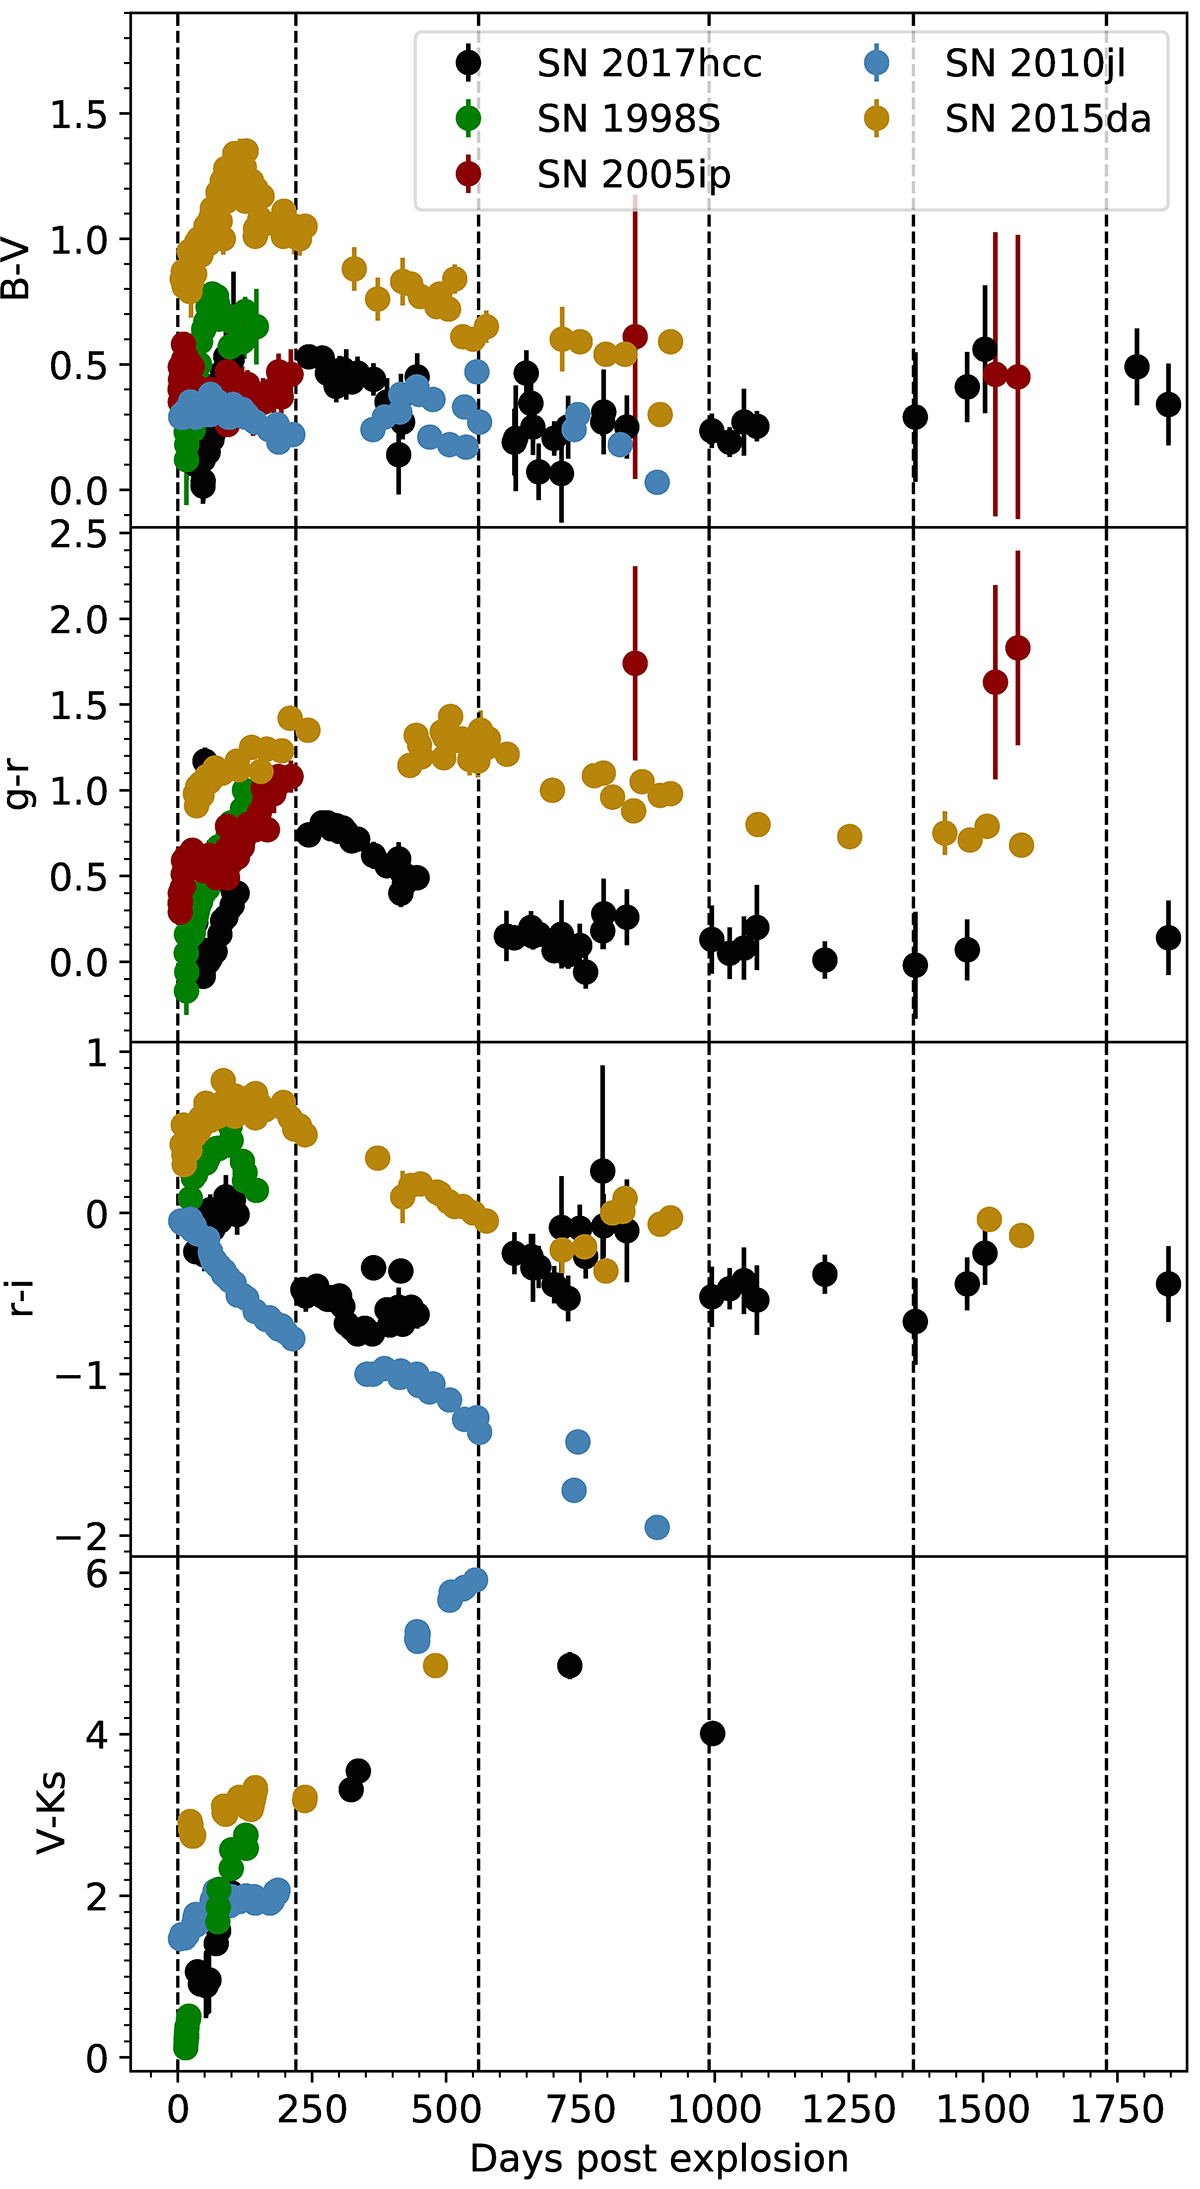
Fig. 4.
Download original image
From top to bottom, B − V, g − r, r − i, and V − Ks colour curves for SN 2017hcc, compared to a selection of SNe IIn. The photometry has been averaged to one MJD (with errors added in quadrature), with colours then having been calculated with observations within one day of each other in the relevant bands, except in the case of the V − Ks observations where a larger window of seven days has been allowed, due to the paucity of observations. The errors bars, when not visible, are smaller than the points. Phases are given against discovery date, except in the case of SN 2017hcc, where the explosion epoch is used. No extinction corrections have been applied to the colours. In the second panel the SN 1998S data are actually V − R rather than g − r and in the third panel both the SN 1998S data and the SN 2015da data are R − I rather than r − i. In the final panel the SN 2010jl and SN 1998S data are actually V − K rather than V − Ks. The dashed vertical lines mark the beginning of seasons one, two, three and four, five and six, respectively.
Current usage metrics show cumulative count of Article Views (full-text article views including HTML views, PDF and ePub downloads, according to the available data) and Abstracts Views on Vision4Press platform.
Data correspond to usage on the plateform after 2015. The current usage metrics is available 48-96 hours after online publication and is updated daily on week days.
Initial download of the metrics may take a while.