Fig. 3.
Download original image
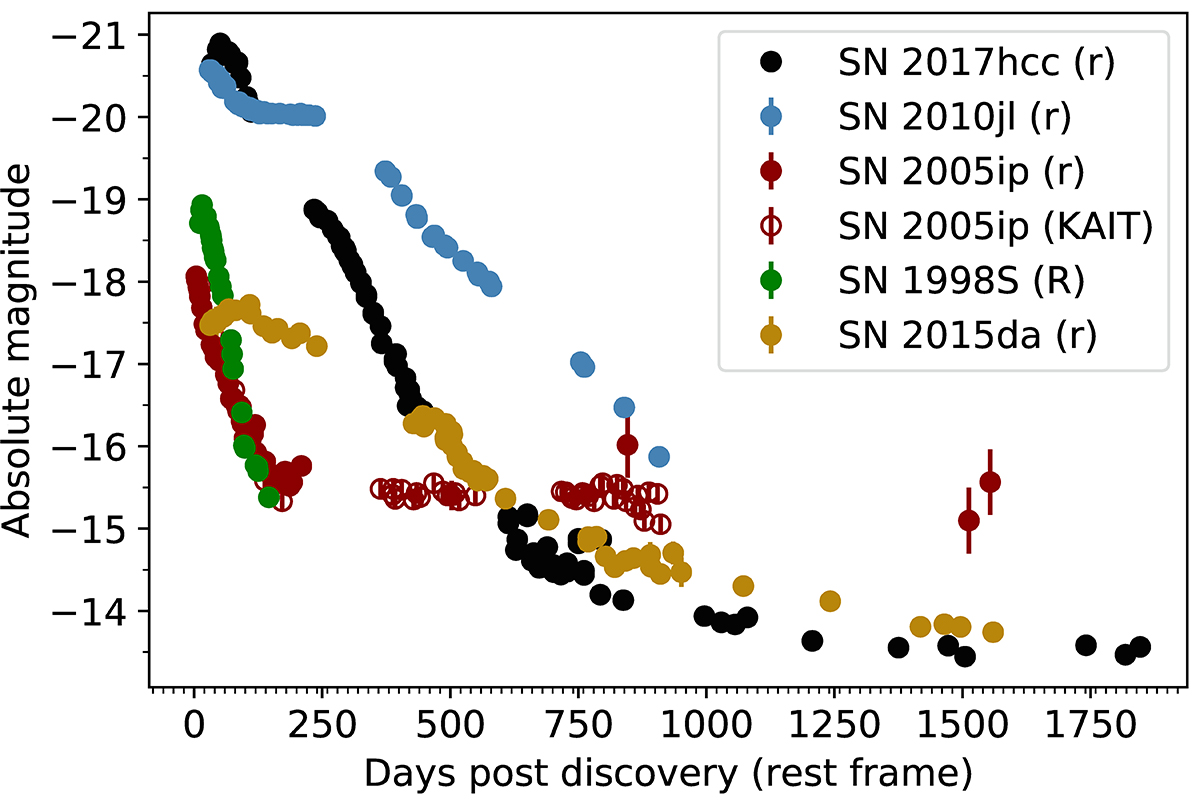
Comparison of the r band light curve of SN 2017hcc with that of SN 2010jl (Fransson et al. 2014) and SN 2005ip (Stritzinger et al. 2012), SN 2015da (Tartaglia et al. 2020) along with the R band photometry of SN 1998S (Fassia et al. 2000). The open circles for SN 2005ip are unfiltered KAIT data (Smith et al. 2009), which are taken to be roughly equivalent to R band. The error bars, where not visible, are smaller than the points. All light curves have been corrected for foreground extinction and time dilation. Phases are given against discovery date. Following (Tartaglia et al. 2020), we do not account for the host extinction of SN 2015da, but note that it could be significant (AR = 2 − 3 mag).
Current usage metrics show cumulative count of Article Views (full-text article views including HTML views, PDF and ePub downloads, according to the available data) and Abstracts Views on Vision4Press platform.
Data correspond to usage on the plateform after 2015. The current usage metrics is available 48-96 hours after online publication and is updated daily on week days.
Initial download of the metrics may take a while.