Open Access
Fig. 2.
Download original image
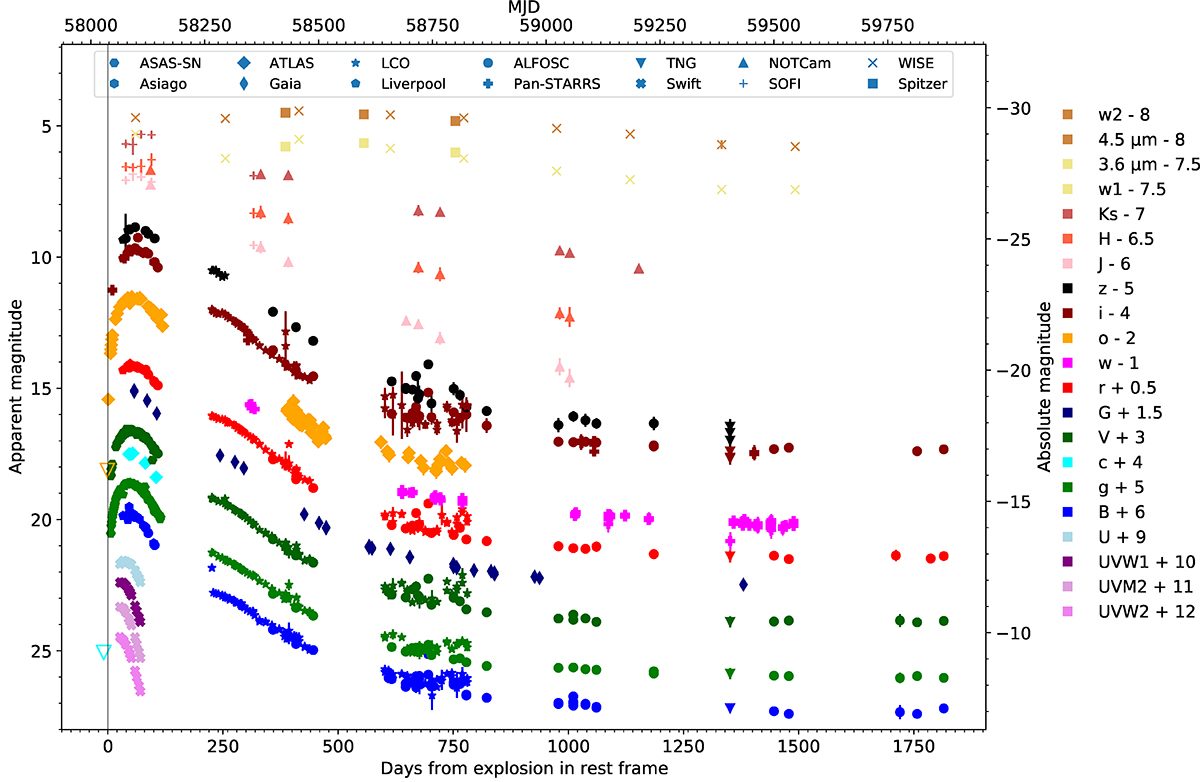
Full UV to MIR light curve of SN 2017hcc. The ATLAS points have been averaged to within 0.3 MJD. The ATLAS upper limits have been marked with inverted open triangles. A vertical line has been placed at the explosion epoch to guide the eye.
Current usage metrics show cumulative count of Article Views (full-text article views including HTML views, PDF and ePub downloads, according to the available data) and Abstracts Views on Vision4Press platform.
Data correspond to usage on the plateform after 2015. The current usage metrics is available 48-96 hours after online publication and is updated daily on week days.
Initial download of the metrics may take a while.