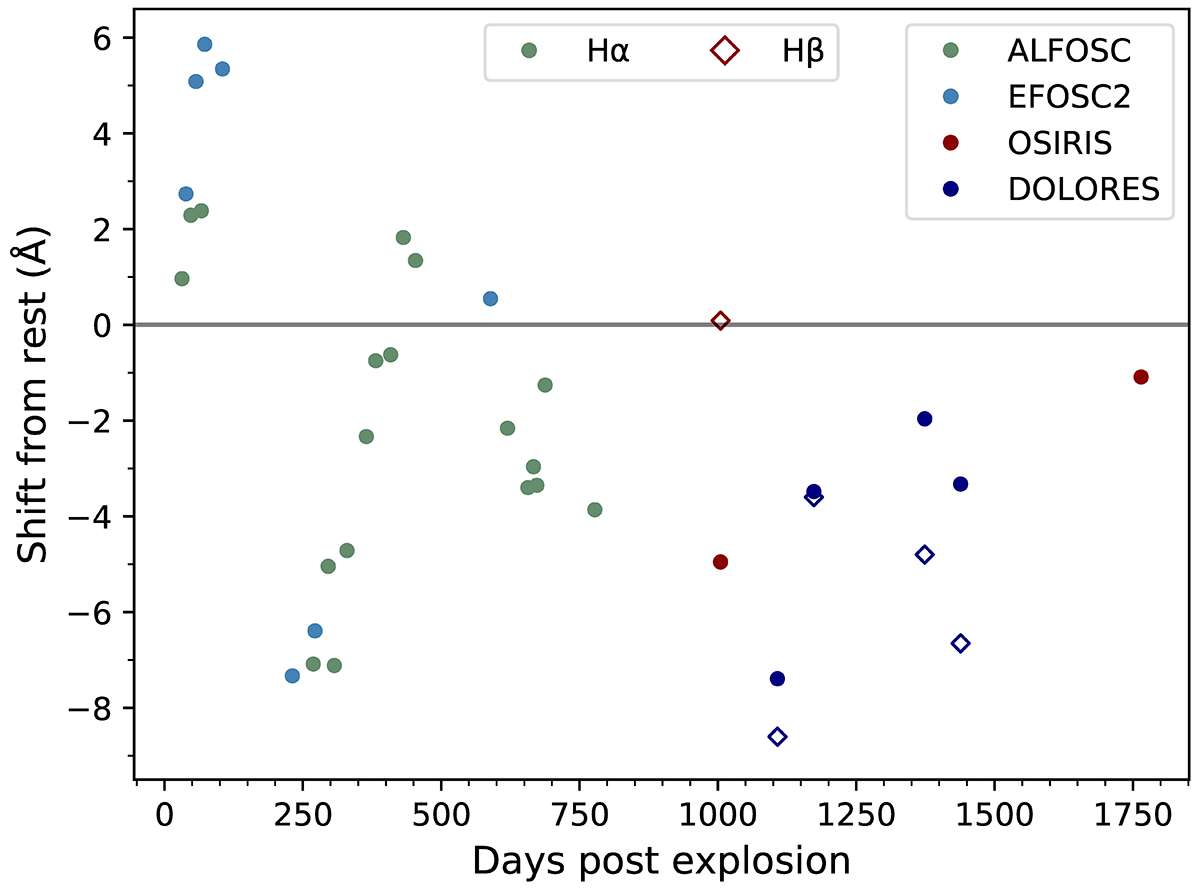
Fig. 17.
Download original image
Selection of spectra showing the evolution of the Hα line centre. The centres have been shifted slightly based on the position of the 6300.31 Å skyline, except in the case of +32 d and +330 d ALFOSC spectra and the +272 d EFOSC spectrum which have been shifted based on the position of the the 5577.34 Å line as the 6300.31 Å line was not detectable.
Current usage metrics show cumulative count of Article Views (full-text article views including HTML views, PDF and ePub downloads, according to the available data) and Abstracts Views on Vision4Press platform.
Data correspond to usage on the plateform after 2015. The current usage metrics is available 48-96 hours after online publication and is updated daily on week days.
Initial download of the metrics may take a while.