Open Access
Fig. 16.
Download original image
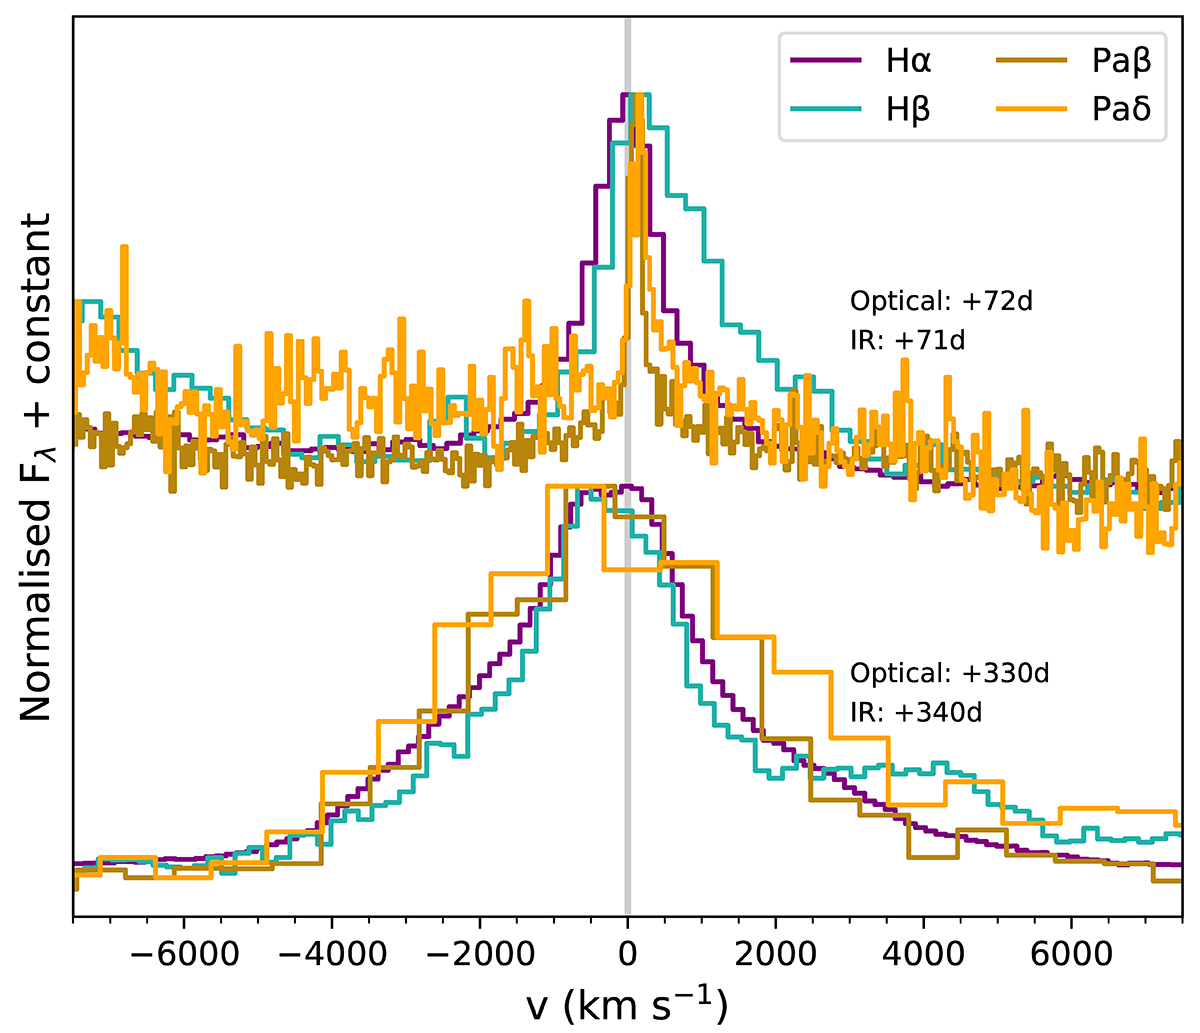
Comparison of the Hα, Hβ, Paβ, and Paδ lines of SN 2017hcc at different epochs (+72 d and +330 d for the optical and +71 d and +340 d for the NIR). The Balmer and Paschen lines at comparable epochs have been overplotted. The lines have been normalised against their peaks. The vertical line marks zero velocity.
Current usage metrics show cumulative count of Article Views (full-text article views including HTML views, PDF and ePub downloads, according to the available data) and Abstracts Views on Vision4Press platform.
Data correspond to usage on the plateform after 2015. The current usage metrics is available 48-96 hours after online publication and is updated daily on week days.
Initial download of the metrics may take a while.