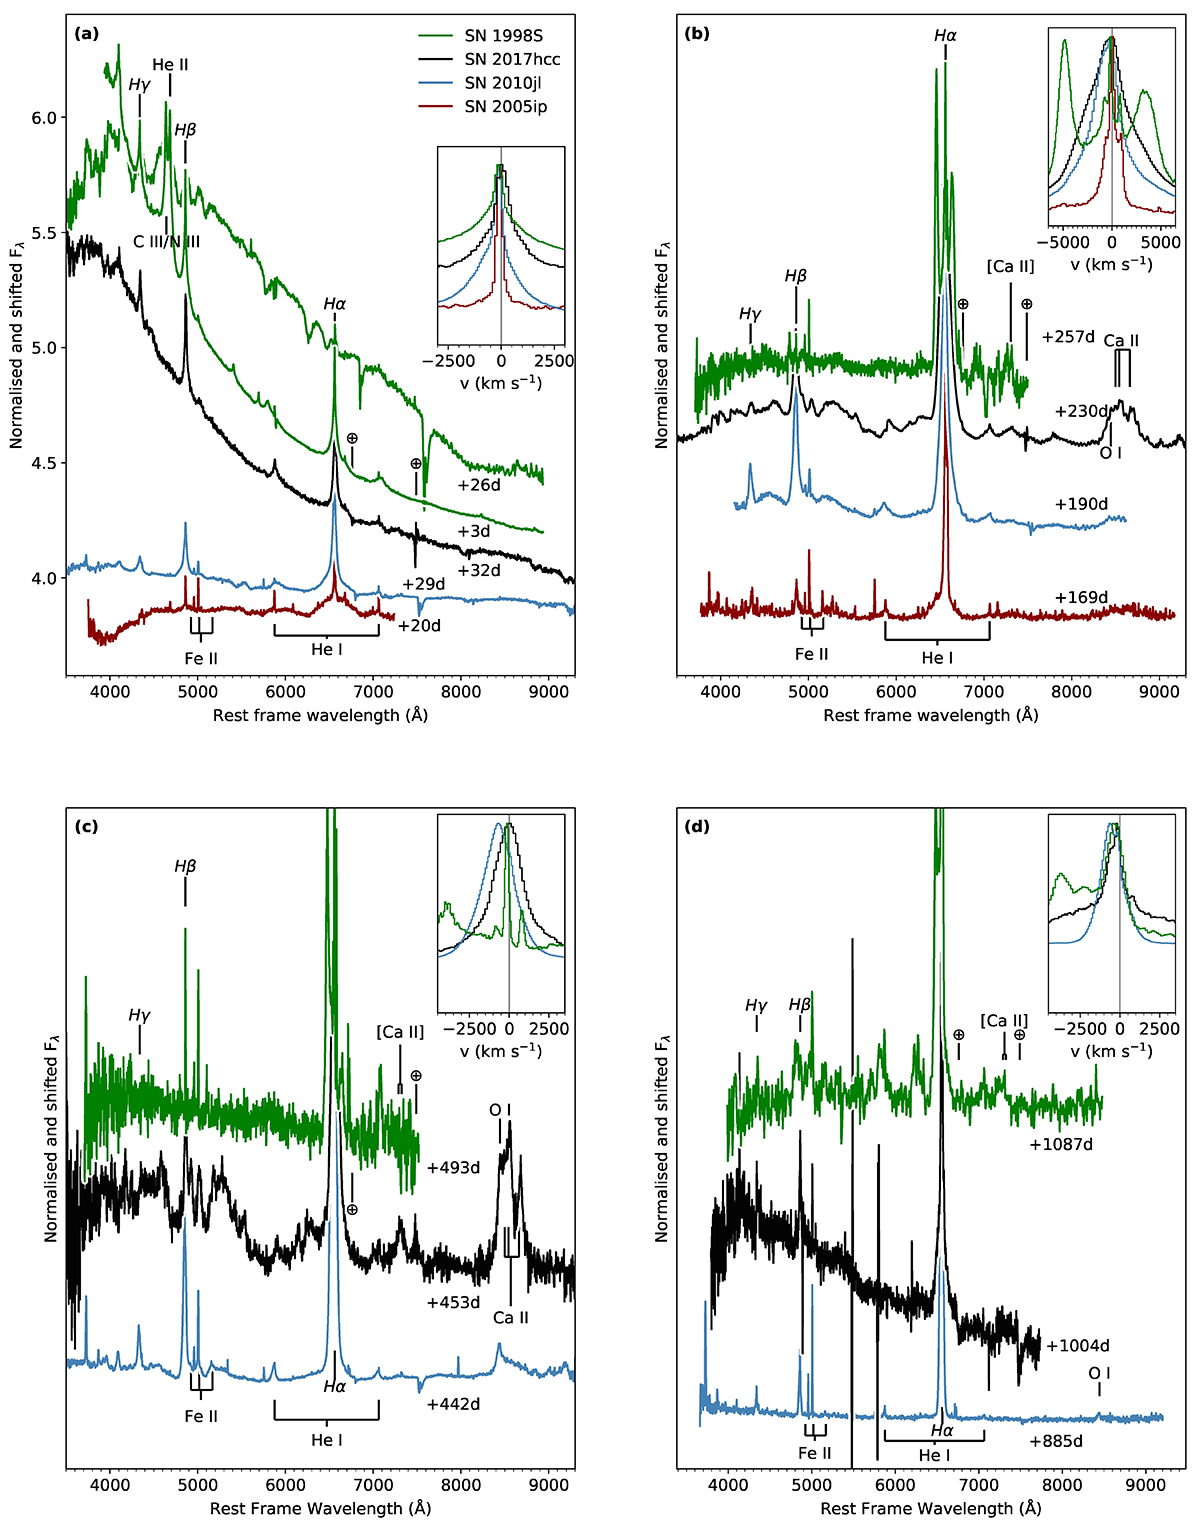
Fig. 13.
Download original image
Spectral comparison of SN 2017hcc with SN 2010jl (Zhang et al. 2012; Jencson et al. 2016), SN 2005ip (Stritzinger et al. 2012) and SN 1998S (Leonard et al. 2000; Fransson et al. 2005) at four selected epochs. The spectra have been corrected for redshift. The inset in each panel shows Hα with the rest velocity marked with a vertical line to make the blueshift more obvious. The telluric lines marked are those corresponding to the SN 2017hcc spectra. Phases are given against discovery date, except in the case of SN 2017hcc, where the explosion epoch is used. The flux values for each spectrum have been normalised against the corresponding peak value of Hα.
Current usage metrics show cumulative count of Article Views (full-text article views including HTML views, PDF and ePub downloads, according to the available data) and Abstracts Views on Vision4Press platform.
Data correspond to usage on the plateform after 2015. The current usage metrics is available 48-96 hours after online publication and is updated daily on week days.
Initial download of the metrics may take a while.