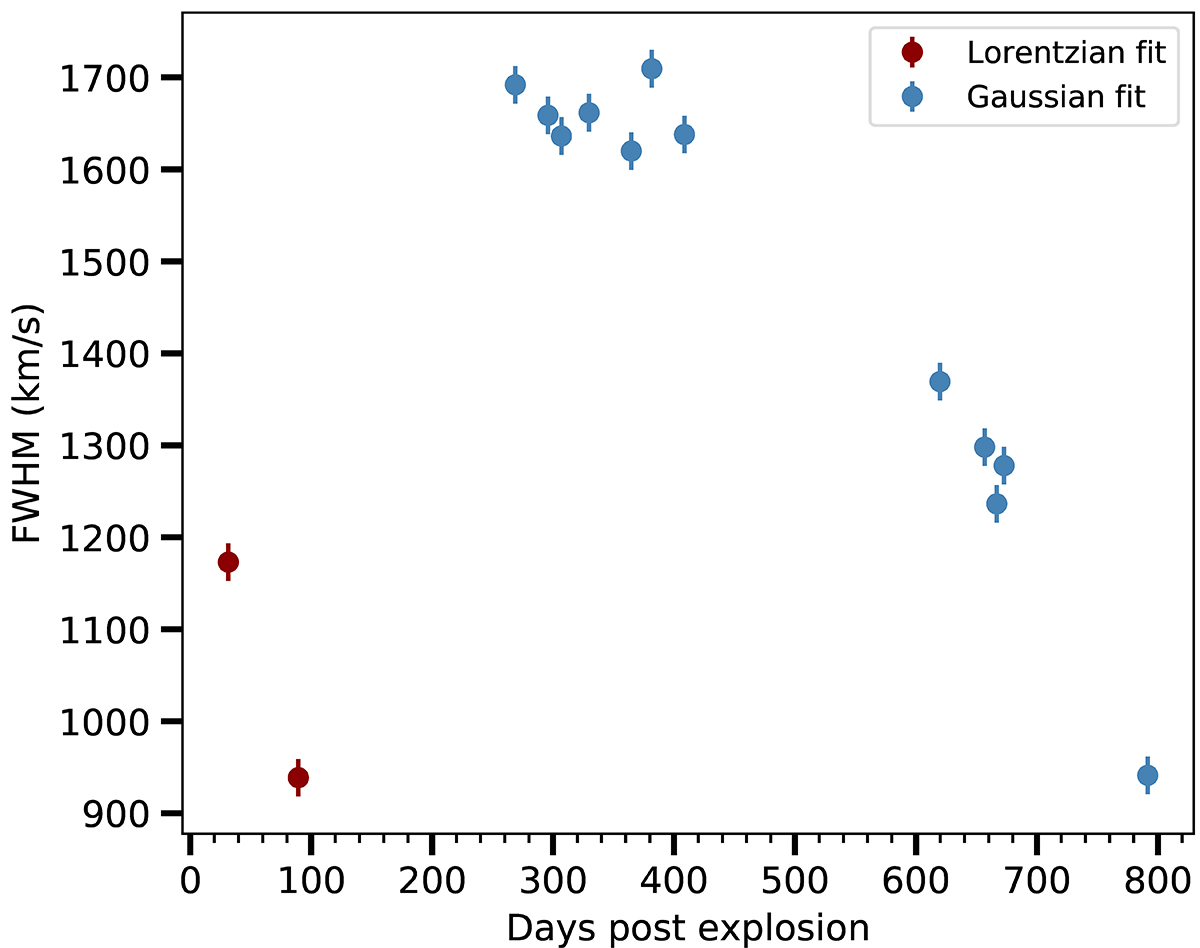
Fig. 10.
Download original image
Evolution of the Hα FWHM in the NOT+ALFOSC Gr#4 1.0″ spectra over time. For each spectrum in the second season (after around +230 d) we fitted two Gaussian profiles to Hα, but those corresponding to the broad base are not shown here. As alluded to above, all spectra were taken with an identical setup. The values have been corrected for instrumental resolution. The errors on each point represent a characteristic error, determined by repeated sampling of the skyline and Hα FWHM of the +306 d spectrum.
Current usage metrics show cumulative count of Article Views (full-text article views including HTML views, PDF and ePub downloads, according to the available data) and Abstracts Views on Vision4Press platform.
Data correspond to usage on the plateform after 2015. The current usage metrics is available 48-96 hours after online publication and is updated daily on week days.
Initial download of the metrics may take a while.