Open Access
Fig. 3
Download original image
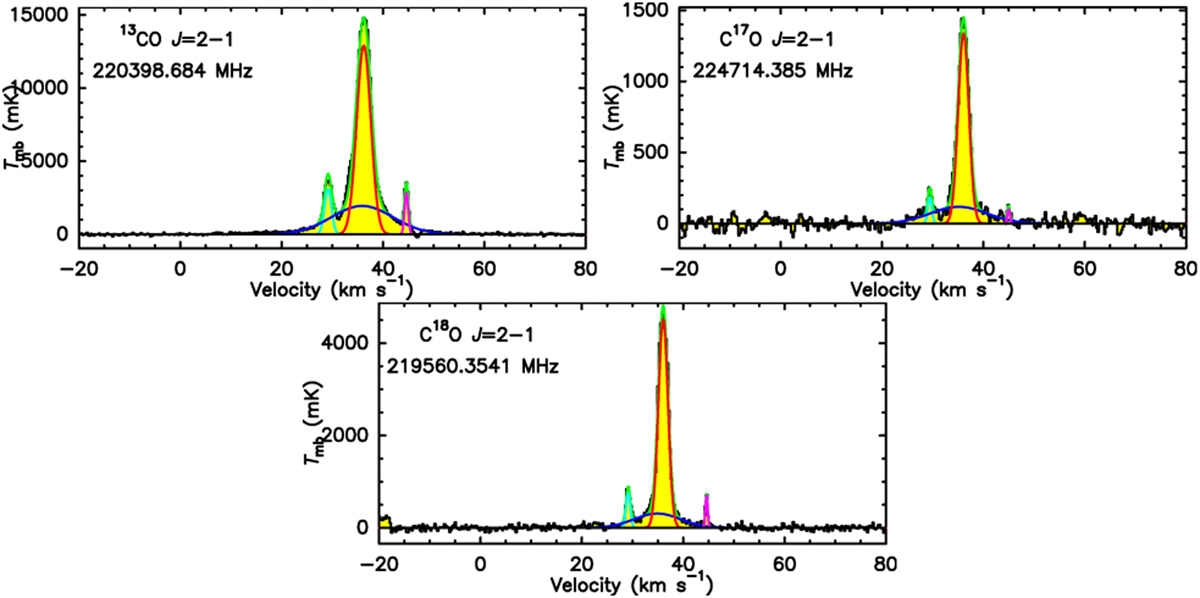
Spectrum (black and filled yellow) of I19312 showing the emission lines of 13CO and C17O. The cyan, red, and pink curves represent the Gaussian fitting profiles of the narrow composition. The blue curve represents the Gaussian fitting profile of the broad composition. The green curves are the total fitting profiles.
Current usage metrics show cumulative count of Article Views (full-text article views including HTML views, PDF and ePub downloads, according to the available data) and Abstracts Views on Vision4Press platform.
Data correspond to usage on the plateform after 2015. The current usage metrics is available 48-96 hours after online publication and is updated daily on week days.
Initial download of the metrics may take a while.