Open Access
Fig. A.2
Download original image
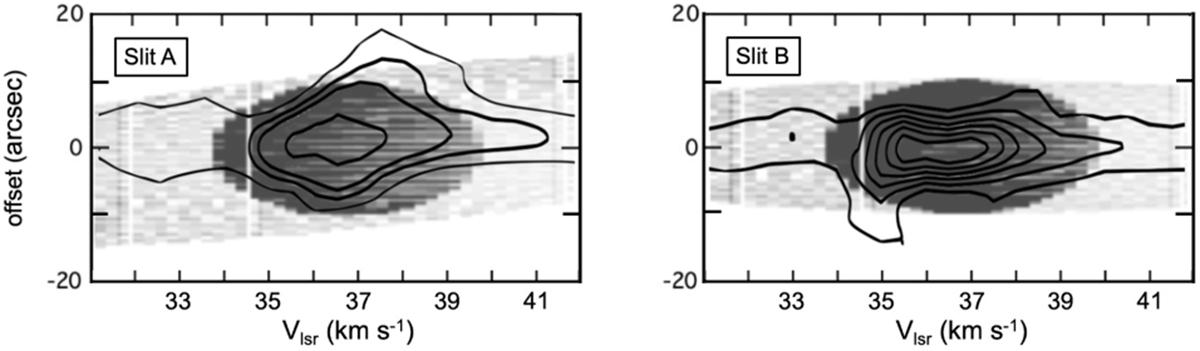
Simulated position-velocity diagrams (grey) of the 13CO J = 2 → 1 line in two orthogonal cuts indicated in Fig. A.1, where Vlsr represents the velocity with respect to the Local Standard of Rest. The contours represent the observational results of Nakashima & Deguchi (2005).
Current usage metrics show cumulative count of Article Views (full-text article views including HTML views, PDF and ePub downloads, according to the available data) and Abstracts Views on Vision4Press platform.
Data correspond to usage on the plateform after 2015. The current usage metrics is available 48-96 hours after online publication and is updated daily on week days.
Initial download of the metrics may take a while.