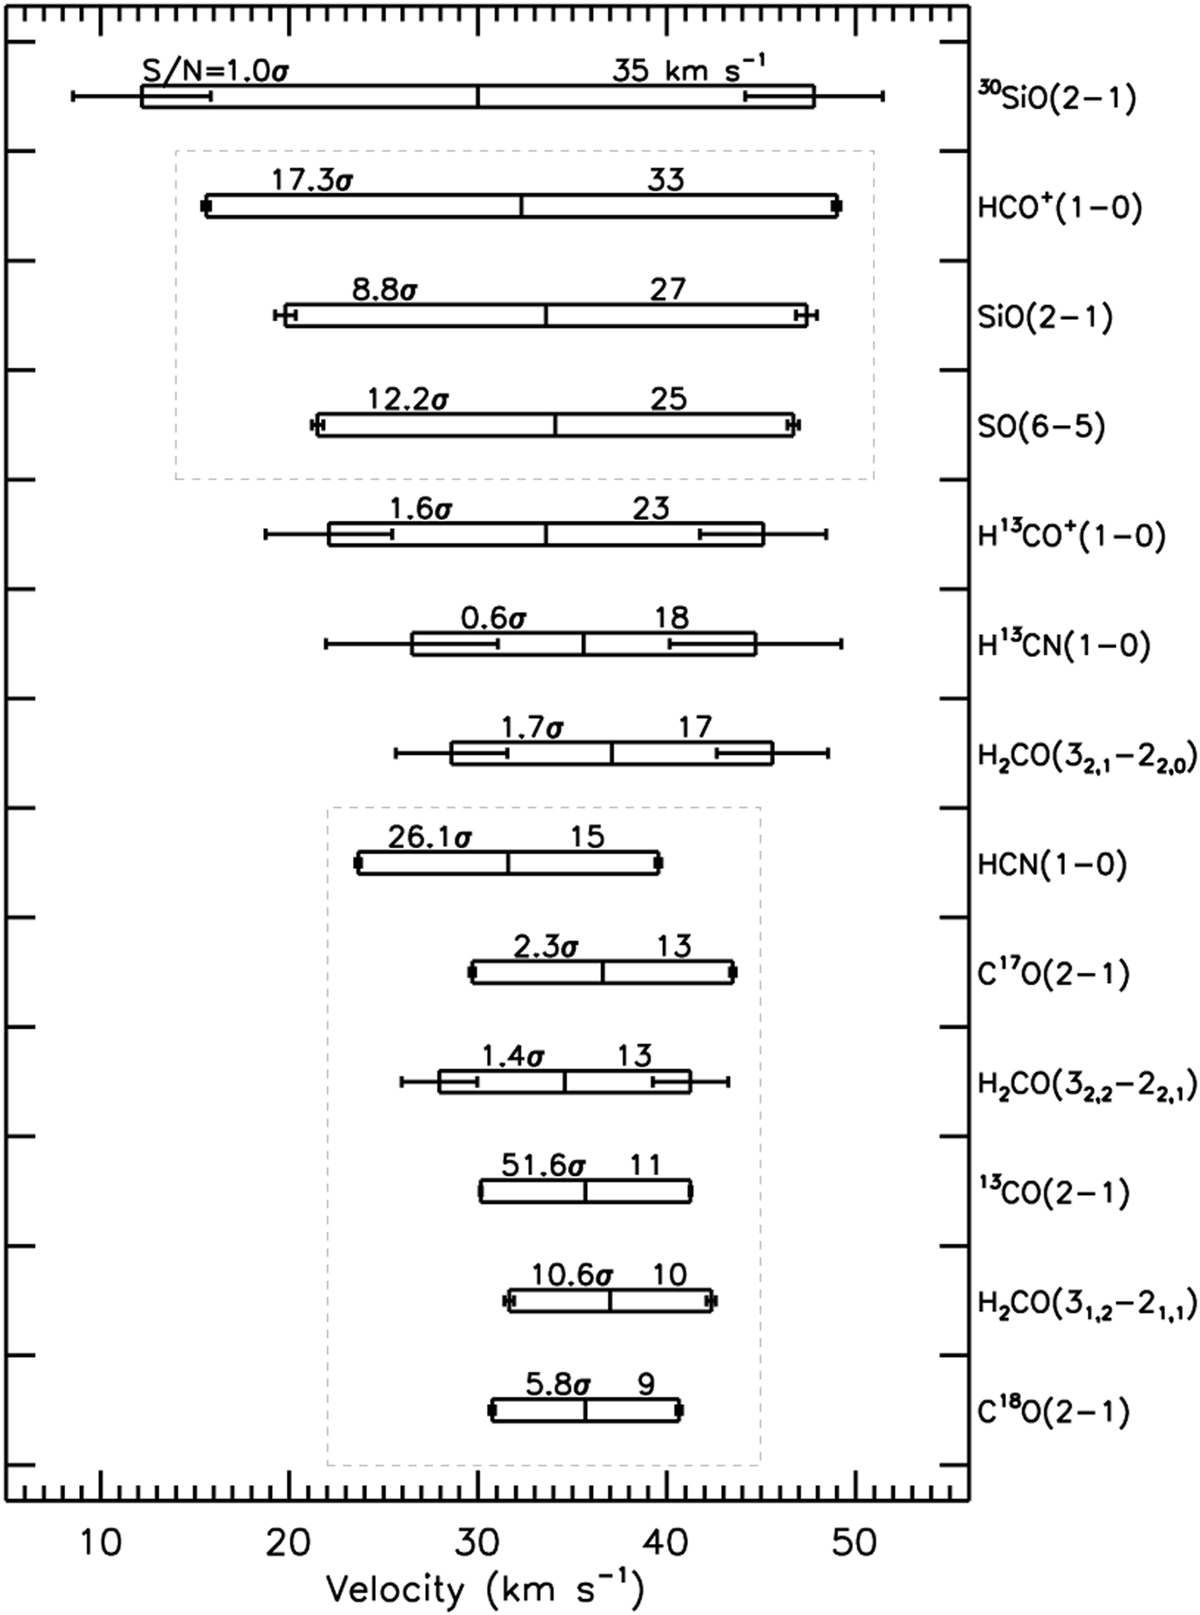
Fig. 16
Download original image
Widths (ΔV1/2; indicated by the horizontal span of the rectangles) and the peak velocities relative to the source (represented by the vertical short bars in the middle of the rectangles) of the broad features. The error bars exhibited on both left and right sides of each rectangle show the uncertainties of ΔV1/2. The S/N number on the upper left of each rectangle is the ratio of the peak temperature of each line to the RMS. The number on the upper right of each rectangle is ΔV1/2 in km s−1. The dashed boxes indicate where the features have an S/N larger than 5σ.
Current usage metrics show cumulative count of Article Views (full-text article views including HTML views, PDF and ePub downloads, according to the available data) and Abstracts Views on Vision4Press platform.
Data correspond to usage on the plateform after 2015. The current usage metrics is available 48-96 hours after online publication and is updated daily on week days.
Initial download of the metrics may take a while.