Fig. 9
Download original image
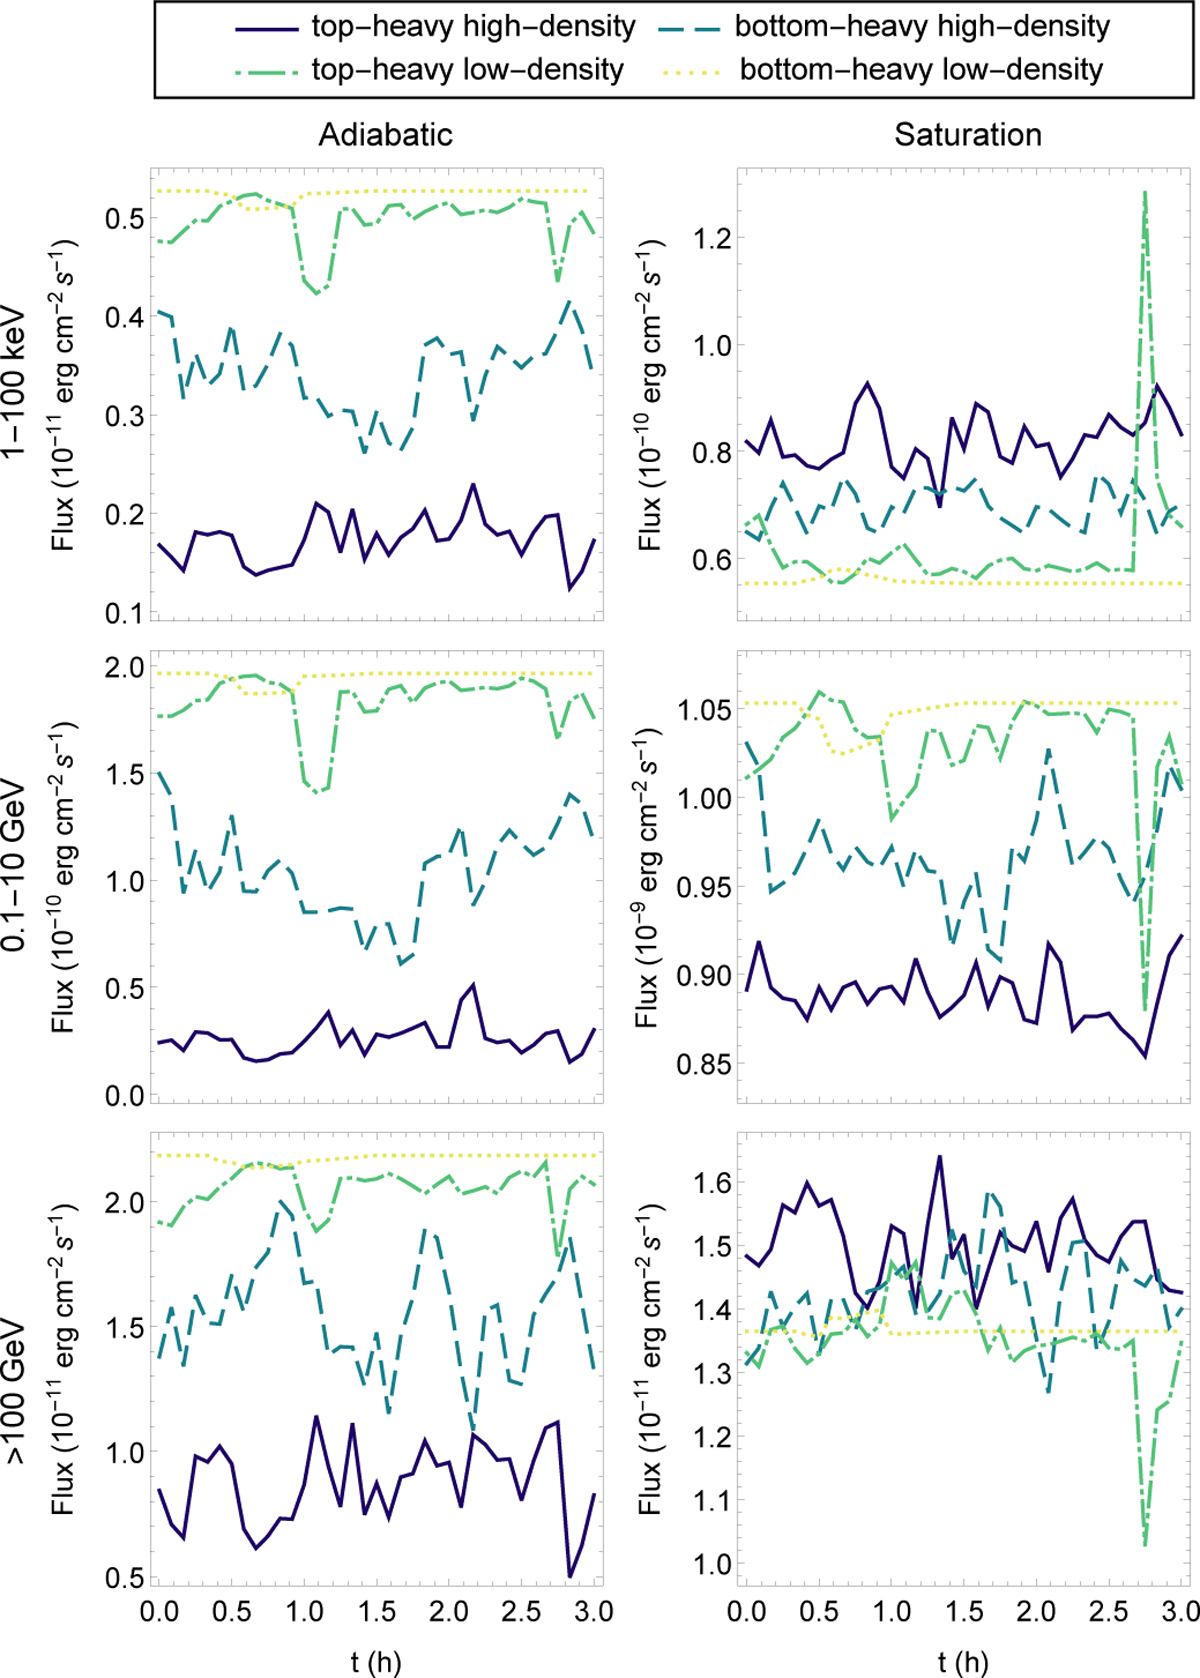
Light curves over a period of 3 h for the adiabatic (left column) and radiative (right column) regimes at energies 1–100 keV (synchrotron only; top rows) and 0.1–10 GeV and >100 GeV (IC only; middle and bottom rows, respectively) for a top-heavy high-density ((k = 2, f = 0.01; solid), a bottom-heavy high-density (k = 3, f = 0.01; dashed), a top-heavy low-density (k = 2, f = 0.1; dashed-dotted), and a bottom-heavy low-density (k = 3, f = 0.1; dotted) clump distribution.
Current usage metrics show cumulative count of Article Views (full-text article views including HTML views, PDF and ePub downloads, according to the available data) and Abstracts Views on Vision4Press platform.
Data correspond to usage on the plateform after 2015. The current usage metrics is available 48-96 hours after online publication and is updated daily on week days.
Initial download of the metrics may take a while.