Fig. 8
Download original image
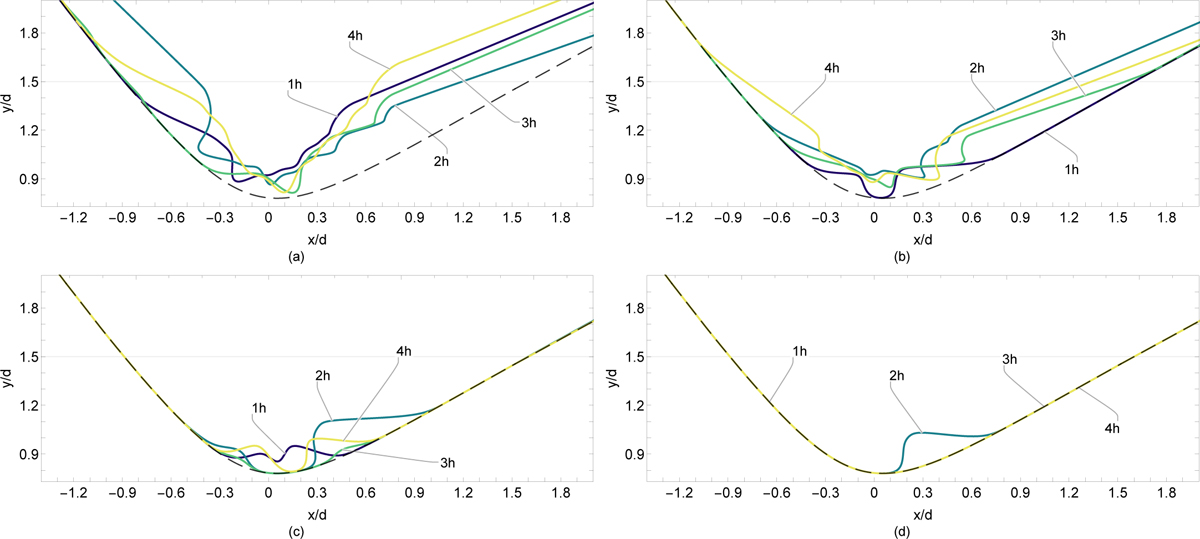
Two-dimensional snapshots of the CD on the orbital plane at 1 h intervals within a period of 3 h for (a) a top-heavy (k = 2) high-density (f = 0.01), (b) a bottom-heavy (k = 3) high-density (f = 0.01), (c) a top-heavy (k = 2) low-density (f = 0.1), and (d) a bottom-heavy (k = 3) low-density (f = 0.1) clump distribution. The black dashed lines correspond to a smooth stellar wind. The horizontal gray lines mark the CD size used to compute the light curves in Fig. 9.
Current usage metrics show cumulative count of Article Views (full-text article views including HTML views, PDF and ePub downloads, according to the available data) and Abstracts Views on Vision4Press platform.
Data correspond to usage on the plateform after 2015. The current usage metrics is available 48-96 hours after online publication and is updated daily on week days.
Initial download of the metrics may take a while.