Fig. 6
Download original image
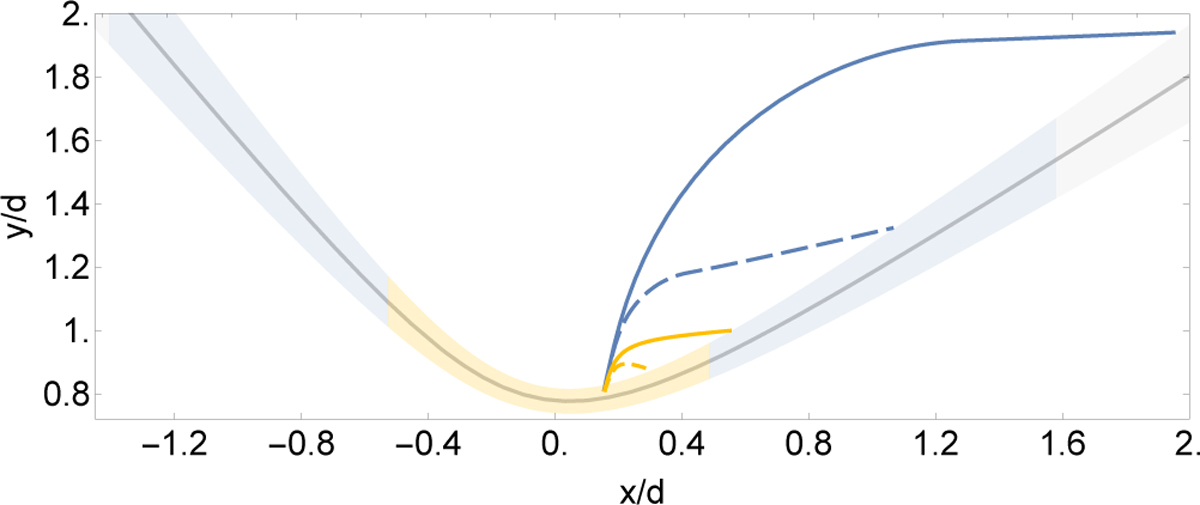
Two-dimensional cut on the orbital plane of the smooth CD (solid gray line) at an intermediate orbital phase (ϕ = 0.28) showing the trajectories of multiple clumps. The light-gray shaded area gives a rough estimate of the thickness of the shocked two-wind region. The blue and yellow lines correspond to high-density and low-density clumps for stellar wind filling factors of f = 0.01 and f = 0.1, respectively. The clump radii when launched from the stellar surface are 0.1 R* (solid) and 0.06 R* (dashed). The colored shaded areas show the regions along the pulsar wind shock front within which the largest high-density (blue shaded area) and low-density (yellow shaded area) clumps can penetrate.
Current usage metrics show cumulative count of Article Views (full-text article views including HTML views, PDF and ePub downloads, according to the available data) and Abstracts Views on Vision4Press platform.
Data correspond to usage on the plateform after 2015. The current usage metrics is available 48-96 hours after online publication and is updated daily on week days.
Initial download of the metrics may take a while.