Fig. 3
Download original image
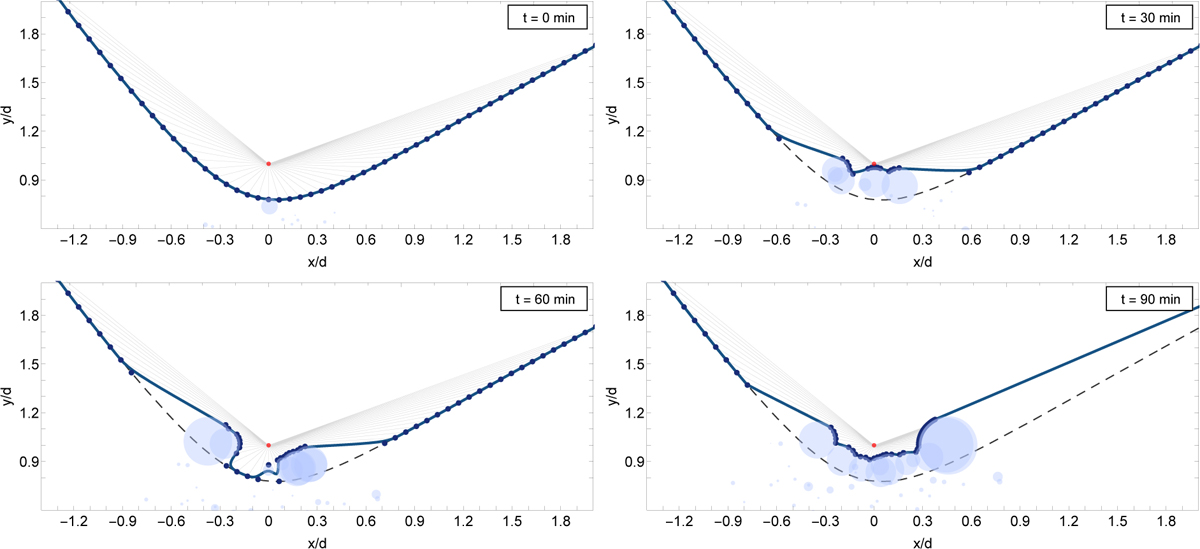
Two-dimensional snapshots of a CD section at 30 min intervals showing the derivation of the distorted CD shape. Radial lines (light gray lines) are traced from the pulsar (red point; not in scale) in all directions. If a line intersects the surface of a shocked clump (light blue disks) before reaching the smooth-wind CD (black dashed line), then a distorted-CD point is placed at this location; otherwise, the intersection point of the radial line with the smooth-wind CD is added to the grid. The new grid of points (dark blue points on the blue line) representing the distorted CD is fitted by a spline (blue solid line).
Current usage metrics show cumulative count of Article Views (full-text article views including HTML views, PDF and ePub downloads, according to the available data) and Abstracts Views on Vision4Press platform.
Data correspond to usage on the plateform after 2015. The current usage metrics is available 48-96 hours after online publication and is updated daily on week days.
Initial download of the metrics may take a while.