Fig. 8
Download original image
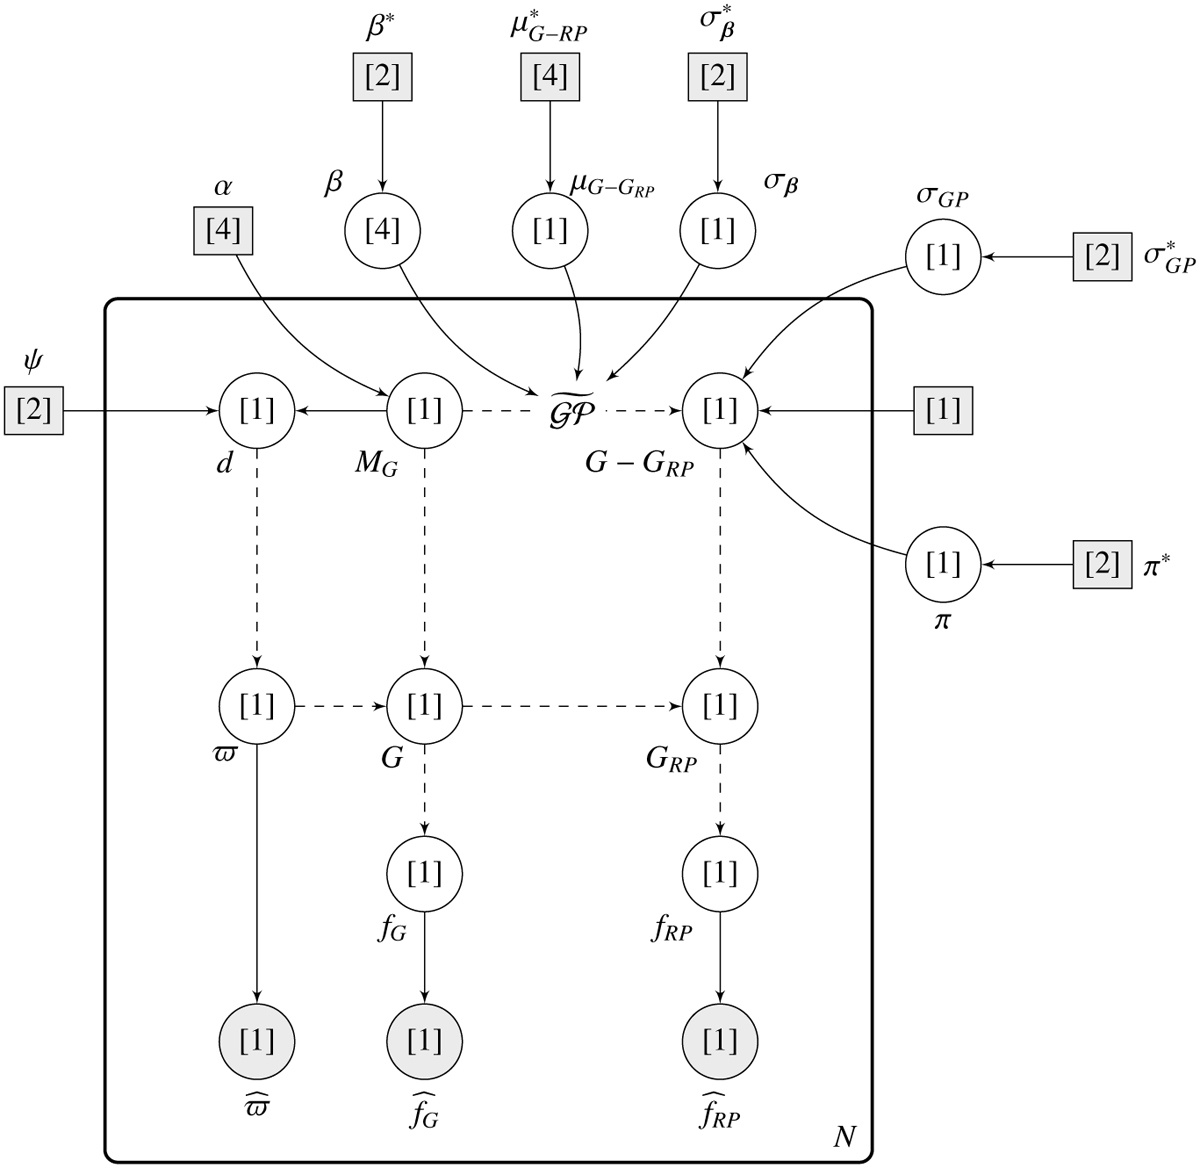
Hierarchical model in plate notation. Squares indicate fixed hyperparameters, and circles indicate random variables. Filled-in shapes indicate fixed values that are not subject to inference. Dashed lines indicate a functional non-probabilistic relationship. The dimension of the parameter vectors are indicated inside the shapes in brackets, and the fixed hyperparameters are listed in Table 2. For instance, ![]() are the parameters of the Lognormal prior for σβ.
are the parameters of the Lognormal prior for σβ.
Current usage metrics show cumulative count of Article Views (full-text article views including HTML views, PDF and ePub downloads, according to the available data) and Abstracts Views on Vision4Press platform.
Data correspond to usage on the plateform after 2015. The current usage metrics is available 48-96 hours after online publication and is updated daily on week days.
Initial download of the metrics may take a while.