Fig. 5
Download original image
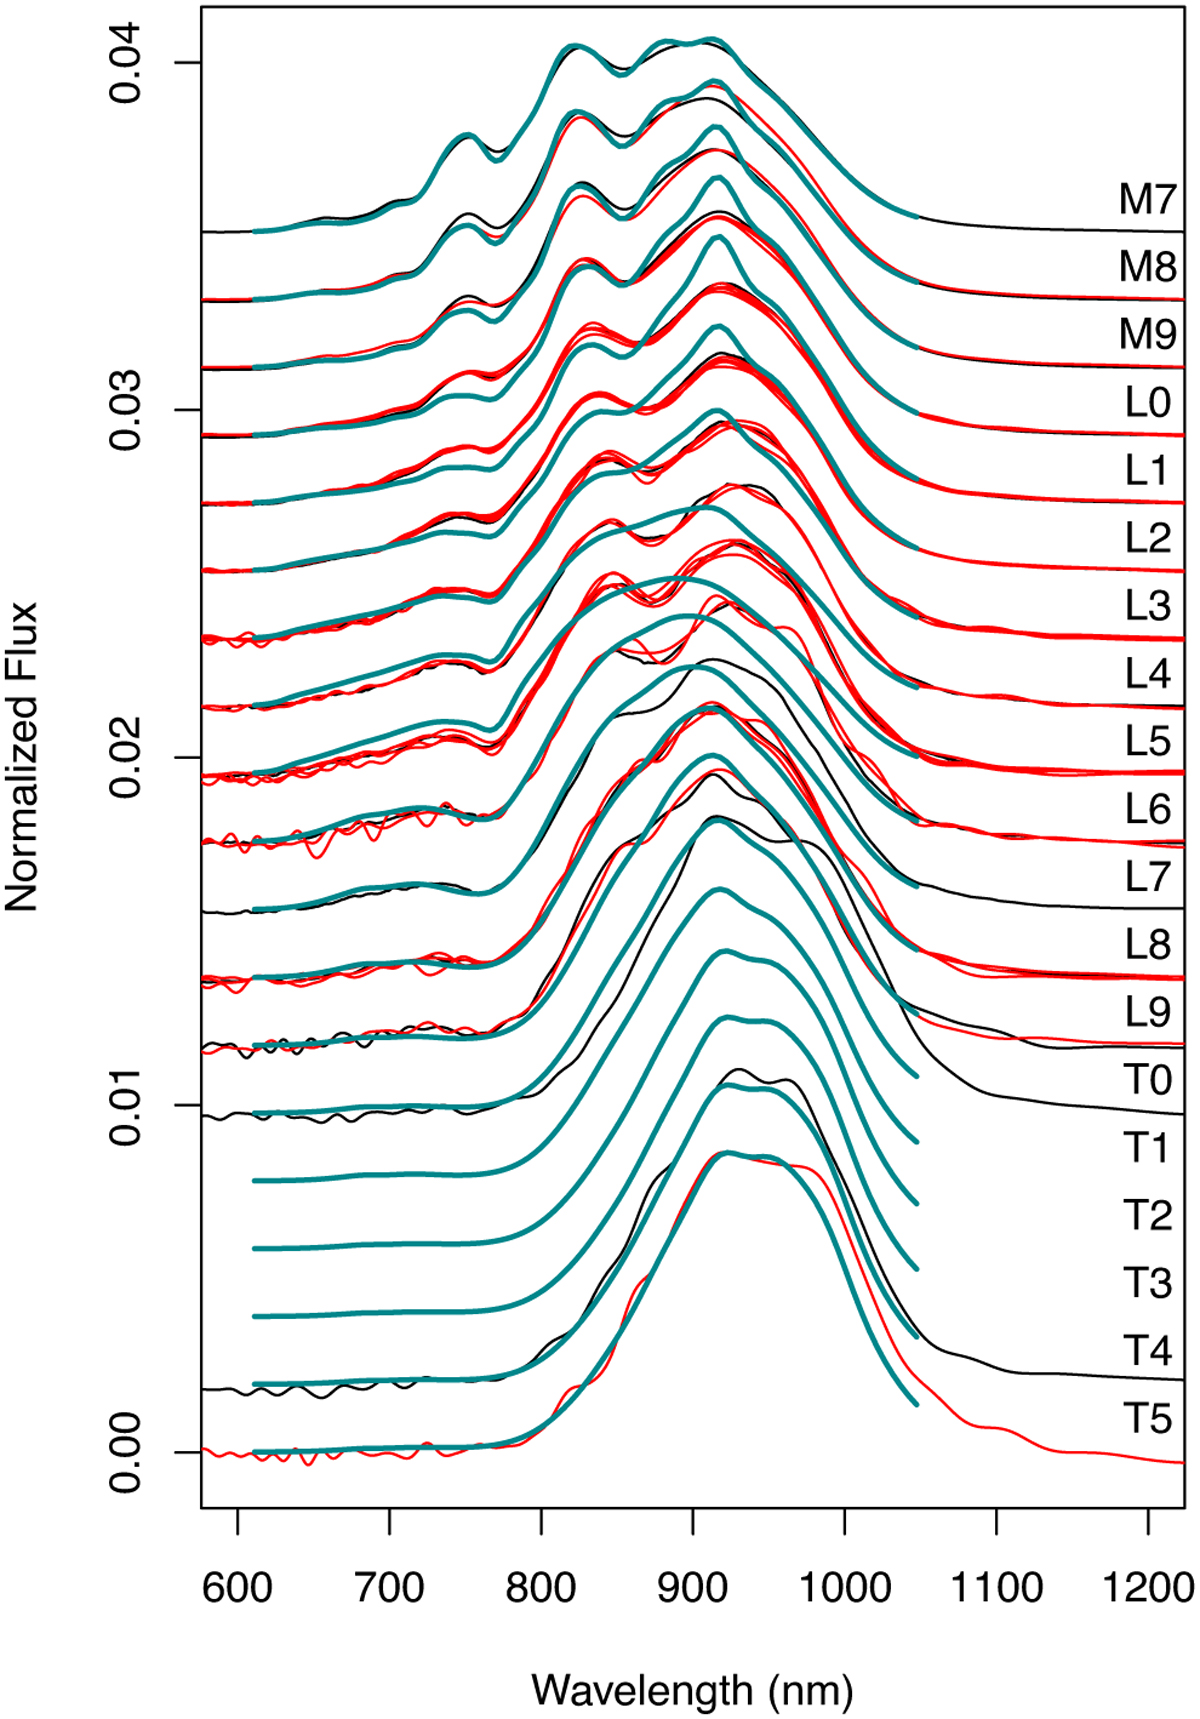
RP spectra for spectral types in the UCD regime, from M7 to T6. The red lines are spectral type comparison objects, black lines represent the median RP spectrum of all UCD candidates in each spectral type, and the turquoise lines represent the MIOG simulations based on BT-Settl synthetic spectra. The conversion between effective temperatures and spectral types for the black and turquoise lines is done using the calibrations of Stephens et al. (2009).
Current usage metrics show cumulative count of Article Views (full-text article views including HTML views, PDF and ePub downloads, according to the available data) and Abstracts Views on Vision4Press platform.
Data correspond to usage on the plateform after 2015. The current usage metrics is available 48-96 hours after online publication and is updated daily on week days.
Initial download of the metrics may take a while.