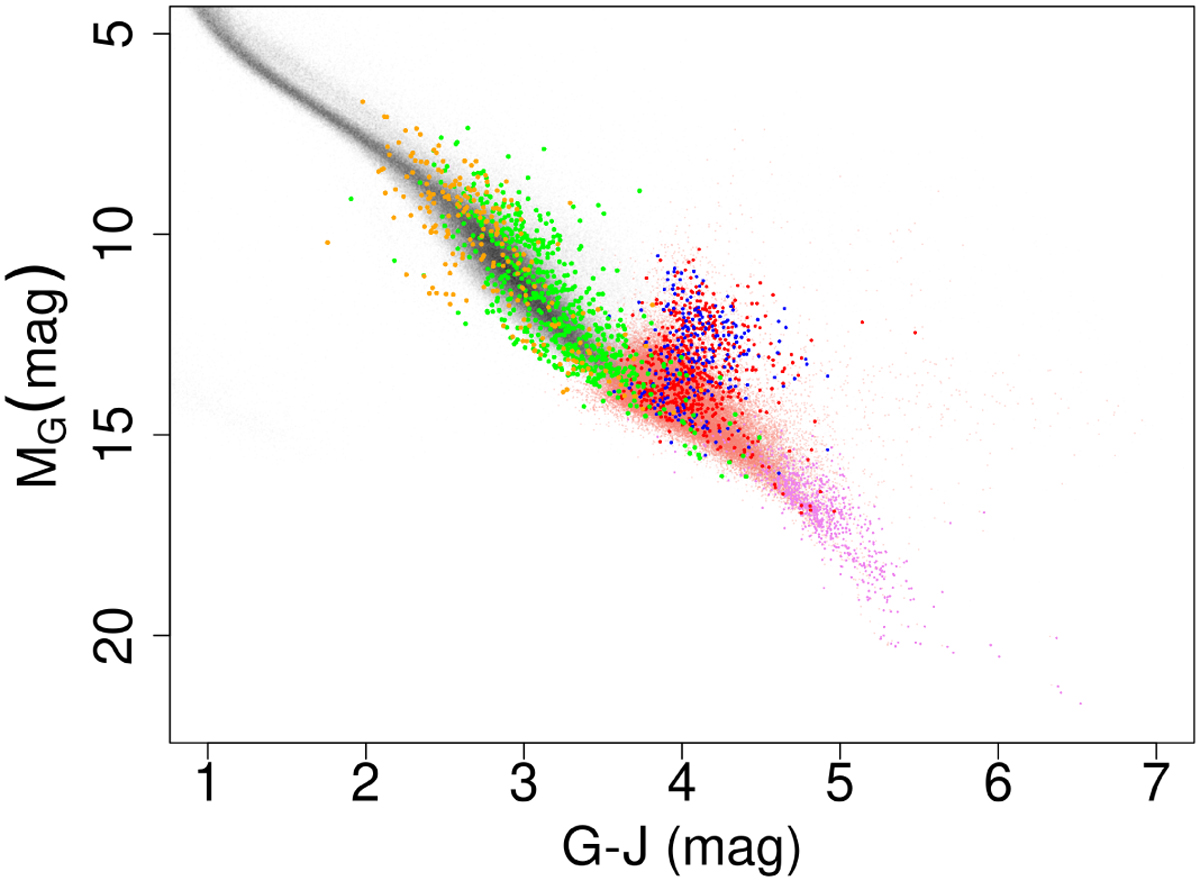
Fig. C.18
Download original image
Distribution of sources in the residual overdensities marked in red and blue in the lower-right panel of Fig. 15 in the CAMD diagram of (G − J) and MG. It shows the main sequence derived from the GCNS as black dots (using transparency); the list of sources in our catalogue of UCDs in HMAC groups of fewer than ten members (salmon dots with transparency); the GUCDS (violet dots); and the position of the sources in the blue and red overdensities after de-reddening using the Planck GNILC (Planck Collaboration XLVIII2016) dust map as orange and green dots, respectively.
Current usage metrics show cumulative count of Article Views (full-text article views including HTML views, PDF and ePub downloads, according to the available data) and Abstracts Views on Vision4Press platform.
Data correspond to usage on the plateform after 2015. The current usage metrics is available 48-96 hours after online publication and is updated daily on week days.
Initial download of the metrics may take a while.