Fig. 20
Download original image
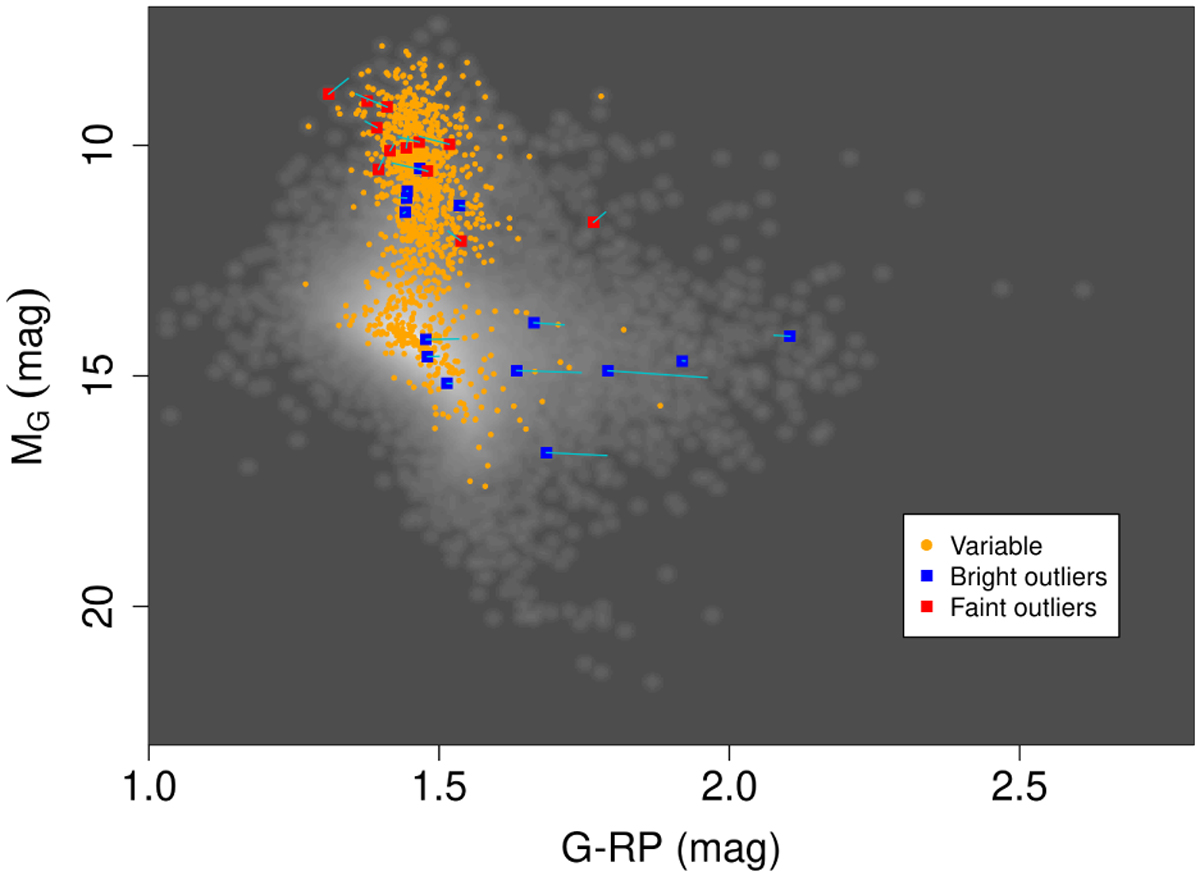
Kernel density estimate of the distribution of UCD candidates in the Gaia CAMD (grey scale). Candidates with entries in the vari_summary table are marked as orange circles; blue and red squares mark the extreme cases of bright and faint outliers shown in Fig. 19, respectively. The segments illustrate the displacement in the CAMD between the main archive values of the photometry and the medians available in the vari_summary table.
Current usage metrics show cumulative count of Article Views (full-text article views including HTML views, PDF and ePub downloads, according to the available data) and Abstracts Views on Vision4Press platform.
Data correspond to usage on the plateform after 2015. The current usage metrics is available 48-96 hours after online publication and is updated daily on week days.
Initial download of the metrics may take a while.