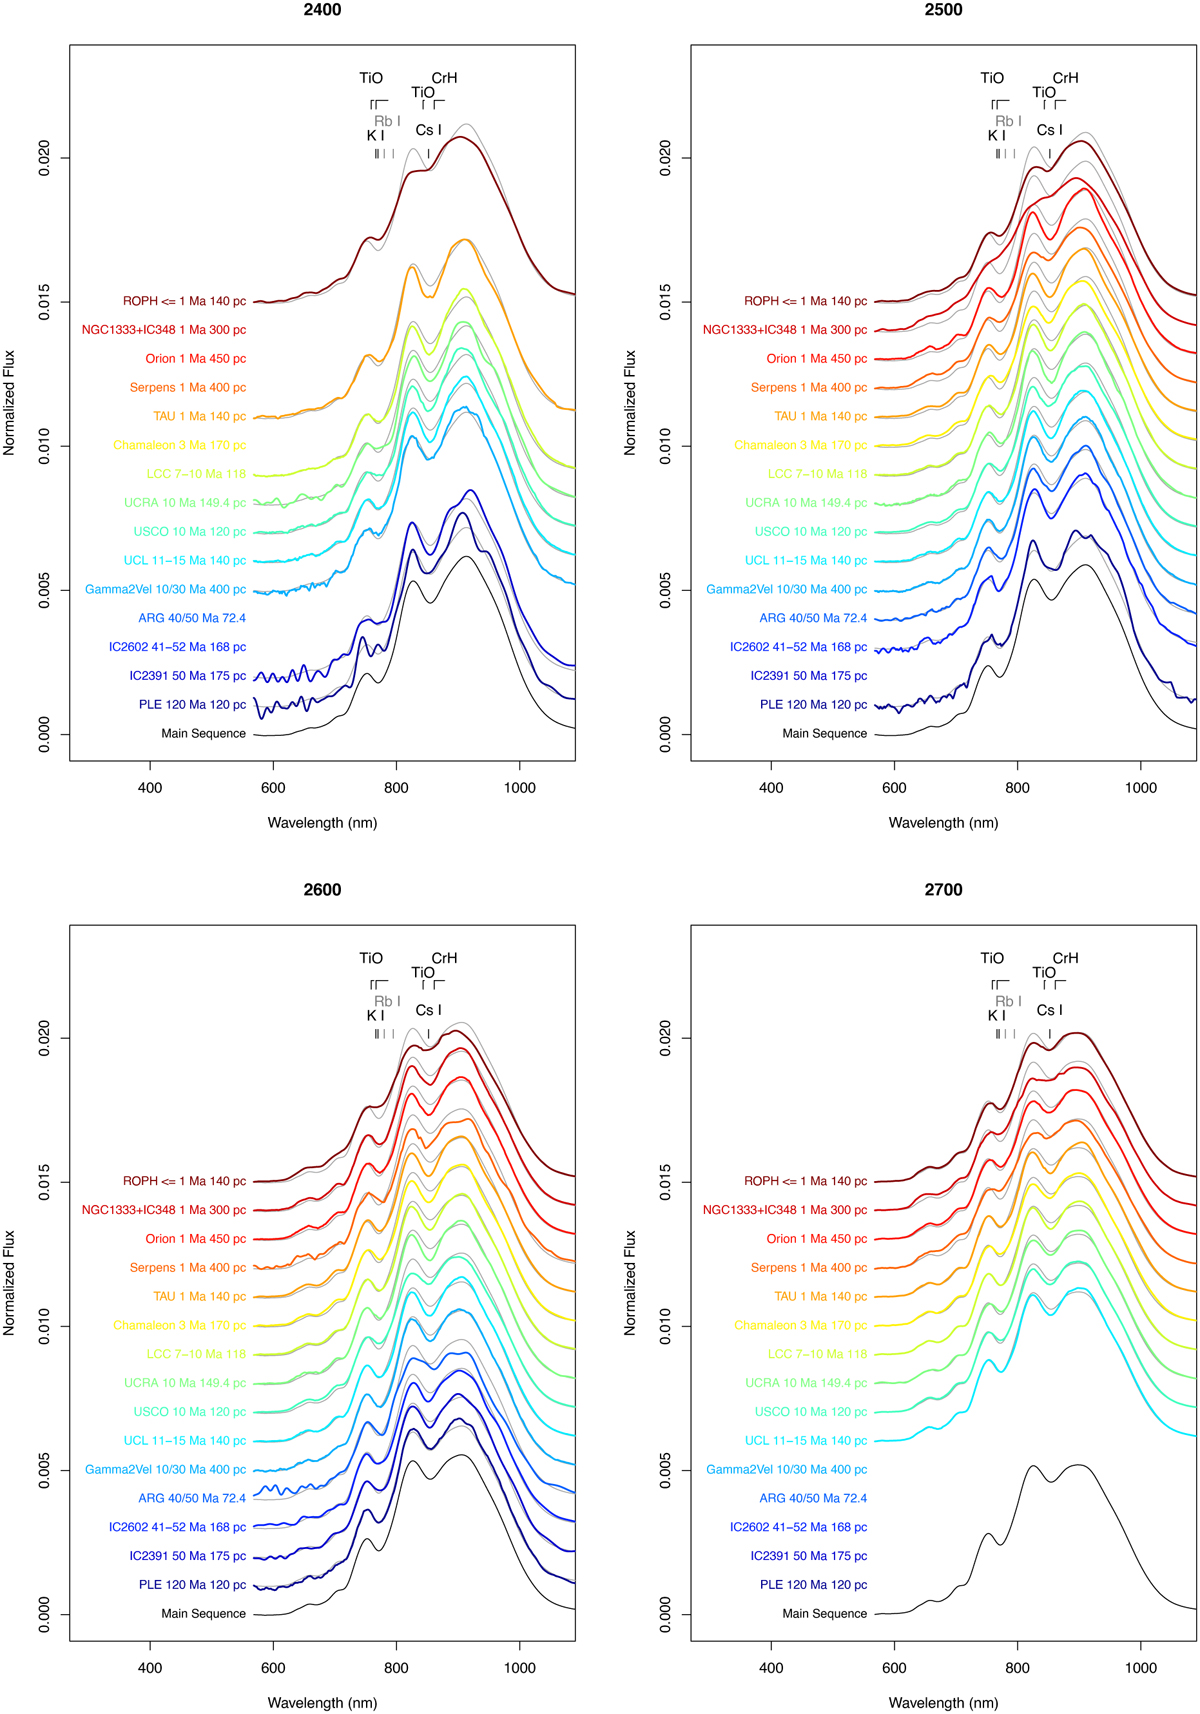
Fig. 18

Download original image
Median RP spectra calculated for sources in the range between 2350 and 2450 K (top left), 2450 and 2550 K (top right), 2550 and 2650 K (bottom left), and 2650 and 2700 K (bottom right) and assigned to the most prominent BANYAN and HMAC groups. The spectra are ordered in age from the top (youngest) to the bottom (oldest). The median RP spectrum for sources outside the overdensities in each temperature bin is labelled ‘nain sequence’ and is shown in black at the bottom and in light grey superimposed on each group.
Current usage metrics show cumulative count of Article Views (full-text article views including HTML views, PDF and ePub downloads, according to the available data) and Abstracts Views on Vision4Press platform.
Data correspond to usage on the plateform after 2015. The current usage metrics is available 48-96 hours after online publication and is updated daily on week days.
Initial download of the metrics may take a while.


