Open Access
Fig. 14
Download original image
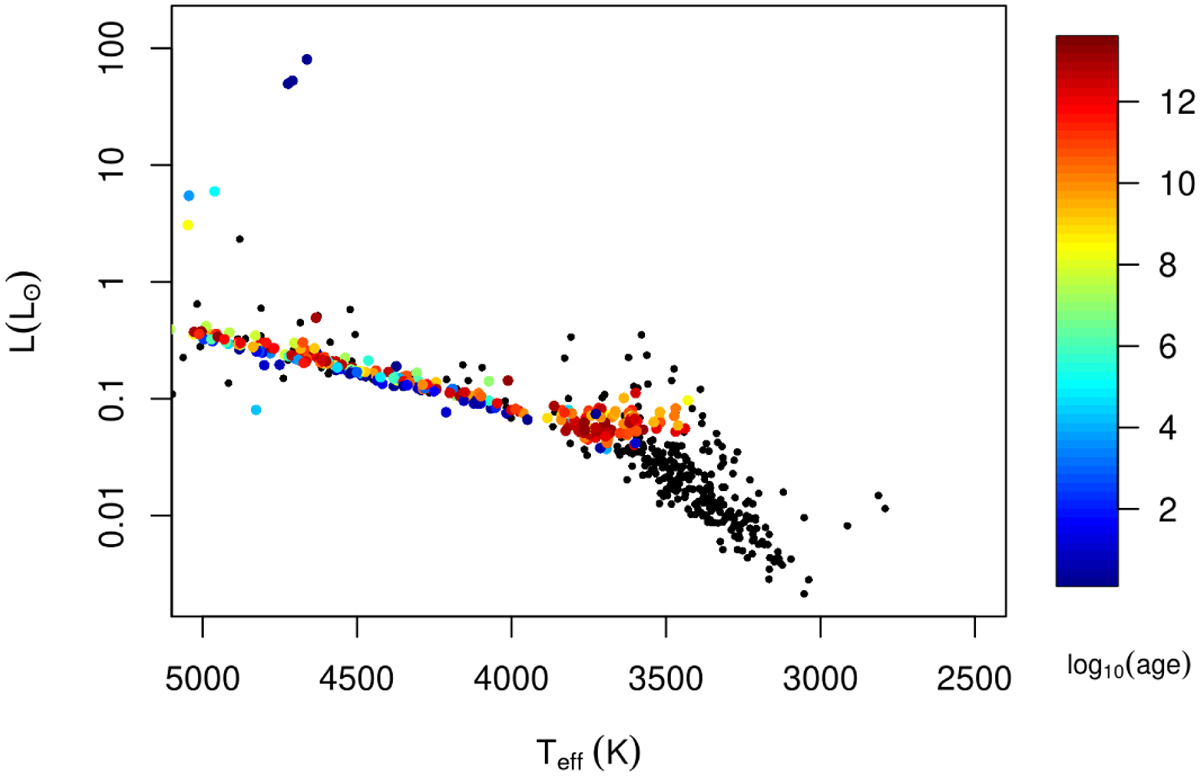
Scatter plot of effective temperatures from the GSP-Phot module (x-axis) and luminosities from FLAME (y-axis) for primaries in systems where both components have ϖ/σϖ > 15. Coloured circles correspond to sources with available age estimates from FLAME. The colour code represents the decadic logarithm of the age.
Current usage metrics show cumulative count of Article Views (full-text article views including HTML views, PDF and ePub downloads, according to the available data) and Abstracts Views on Vision4Press platform.
Data correspond to usage on the plateform after 2015. The current usage metrics is available 48-96 hours after online publication and is updated daily on week days.
Initial download of the metrics may take a while.