Fig. 7.
Download original image
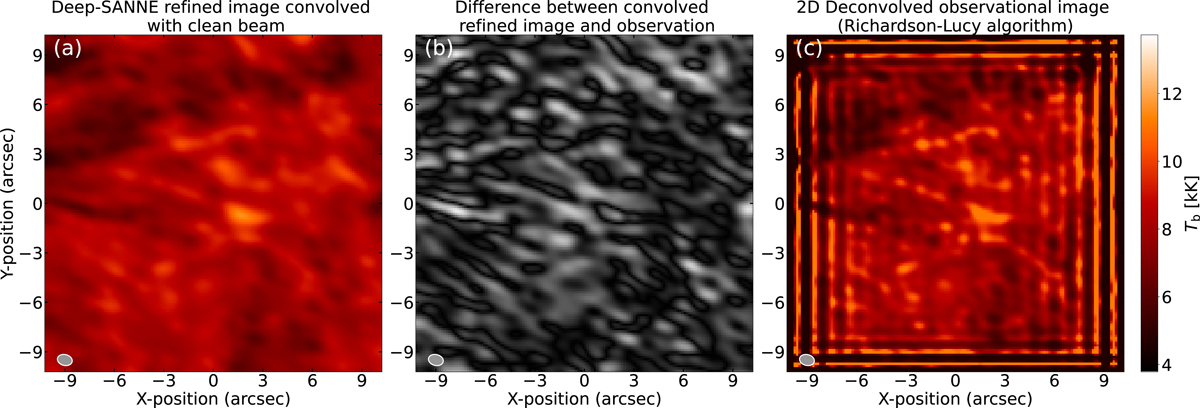
Comparison of Deep-SANNE refined image. (a) Deep-SANNE refined image of the observational data (shown in Fig. 6b) convolved with the clean beam corresponding to the observation. The FWHM of the clean beam is marked in the lower left corner. (b) Difference between the convolved Deep-SANNE refined image (panel (a)) and the observational image (Fig. 6a). (c) Observational image (Fig. 6a) deconvolved with the clean beam in the 2D spatial domain, using a standard Richardson-Lucy algorithm.
Current usage metrics show cumulative count of Article Views (full-text article views including HTML views, PDF and ePub downloads, according to the available data) and Abstracts Views on Vision4Press platform.
Data correspond to usage on the plateform after 2015. The current usage metrics is available 48-96 hours after online publication and is updated daily on week days.
Initial download of the metrics may take a while.