Open Access
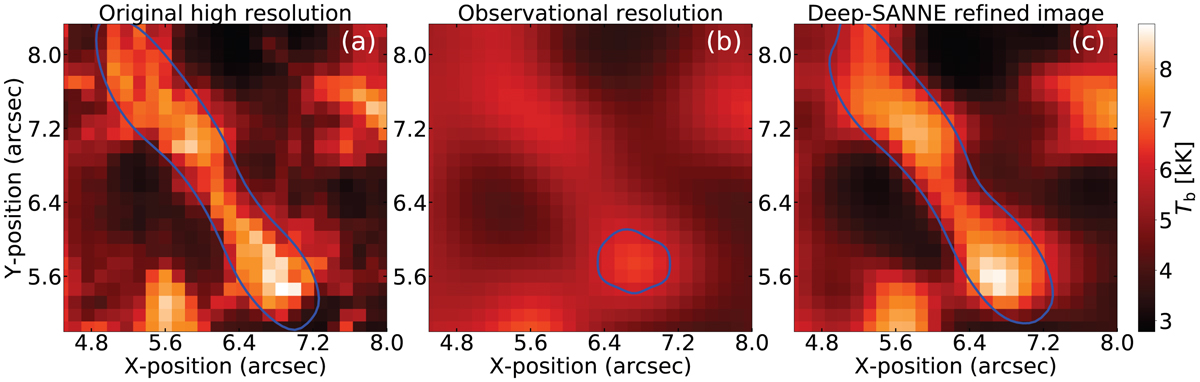
Fig. 5.
Download original image
Zoom-in of a brightening event in the simulation. (a) At original high resolution. (b) At a resolution corresponding to observational data. (c) The Deep-SANNE refined images. The blue contour marks the spatial size of the detected event at the respective series of images.
Current usage metrics show cumulative count of Article Views (full-text article views including HTML views, PDF and ePub downloads, according to the available data) and Abstracts Views on Vision4Press platform.
Data correspond to usage on the plateform after 2015. The current usage metrics is available 48-96 hours after online publication and is updated daily on week days.
Initial download of the metrics may take a while.