Fig. 4.
Download original image
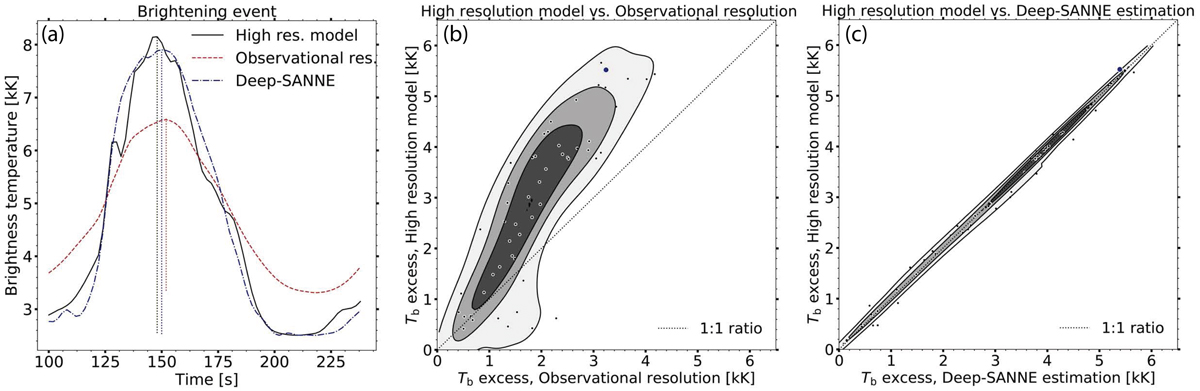
Degradation of brightening events in the simulation. (a) Example of a brightening event with the temporal evolution of the brightness temperature at the degraded angular resolution corresponding to observations (dashed red), of the original high-resolution model (solid black), and of the Deep-SANNE refined images (dot-dashed blue). The apparent magnitude of the temperature excess is in each case marked by the vertical dotted lines. (b) Density plot of the magnitudes of brightening events at high resolution against the observational resolution. (c) Density plot of the magnitudes of brightening events at high resolution against the estimate from the neural network. All events are indicated by circular markers on top of the density plots, with the example from panel a given in blue for reference.
Current usage metrics show cumulative count of Article Views (full-text article views including HTML views, PDF and ePub downloads, according to the available data) and Abstracts Views on Vision4Press platform.
Data correspond to usage on the plateform after 2015. The current usage metrics is available 48-96 hours after online publication and is updated daily on week days.
Initial download of the metrics may take a while.