Fig. 3.
Download original image
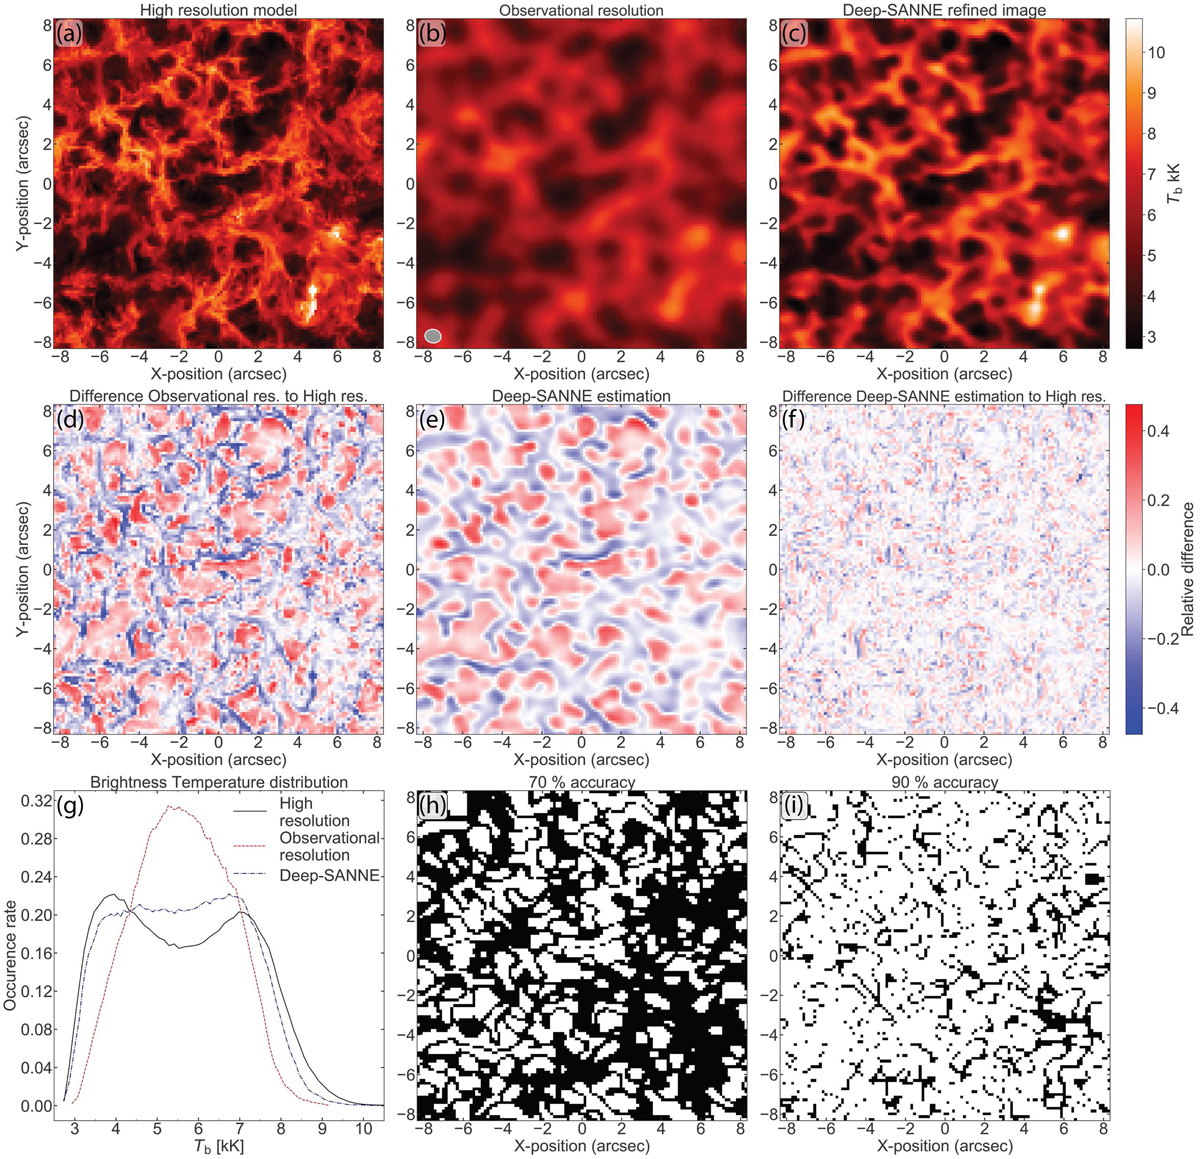
Deep-SANNE estimates of the validation simulation. (a)–(c) Brightness temperatures across the field of view at t = 100 s of the original model at high angular resolution, the model degraded to the angular resolution corresponding to ALMA observations, with the clean beam resolution element marked in the lower left corner and the refined image from the Deep-SANNE estimation, respectively. The color map of the brightness temperatures is the same in each of the three panels. (d) Differences between the maps of brightness temperature at the observational resolution and of the high-resolution model relative to the map at the observational resolution. (e) Estimation of the difference map from Deep-SANNE. (f) Difference map of the brightness temperatures of the Deep-SANNE refined image and the high-resolution model relative the Deep-SANNE refined image. The same color map is given in panels (d)–(f). (g) Distributions of the brightness temperatures between t = 100 s–240 s of the highly resolved model, the observational resolution, and the Deep-SANNE estimate. (h) and (i) Masks from Deep-SANNE showing the locations over the field of view at t = 100 s (in black) where the accuracy of the brightness temperatures at observational resolution is least 70% and 90%, respectively, compared to the highly resolved model.
Current usage metrics show cumulative count of Article Views (full-text article views including HTML views, PDF and ePub downloads, according to the available data) and Abstracts Views on Vision4Press platform.
Data correspond to usage on the plateform after 2015. The current usage metrics is available 48-96 hours after online publication and is updated daily on week days.
Initial download of the metrics may take a while.