Fig. 2.
Download original image
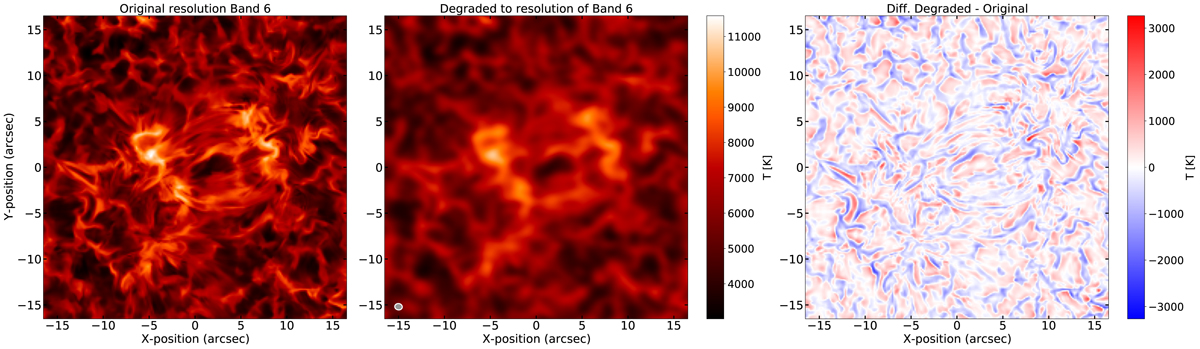
Illustration of simulation data used for training Deep-SANNE. (a) Synthetic brightness temperature map at λ = 1.25 mm at the original high resolution, at 1800 s from the start of the training simulation. (b) The same brightness temperature map degraded to the angular resolution corresponding to ALMA observations. The clean beam with an FWHM of 0.69 × 0.82 arcsec is marked in the lower left corner. (c) Difference between the degraded and the original map with absolute differences of up to 3200 K.
Current usage metrics show cumulative count of Article Views (full-text article views including HTML views, PDF and ePub downloads, according to the available data) and Abstracts Views on Vision4Press platform.
Data correspond to usage on the plateform after 2015. The current usage metrics is available 48-96 hours after online publication and is updated daily on week days.
Initial download of the metrics may take a while.