Open Access
Fig. 8
Download original image
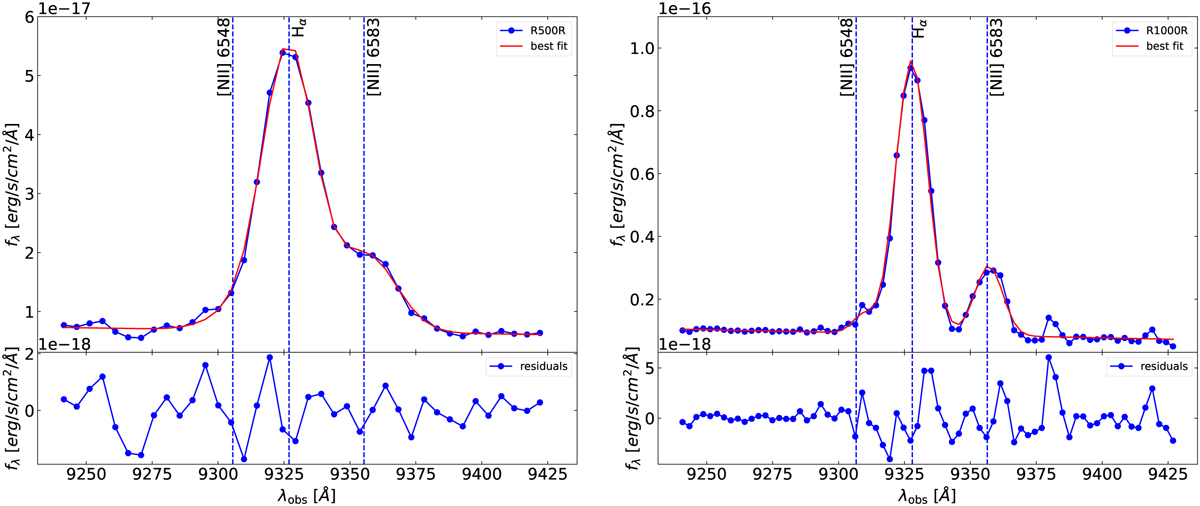
Observed flux fitted to the same object of the faint subset with different grisms in the region of Hα + [N II] 16548,6583. In the upper panels, blue dots and the blue line represent the observed flux, and the red line represents the best fit. The residuals of the fits are plotted in the bottom panels.
Current usage metrics show cumulative count of Article Views (full-text article views including HTML views, PDF and ePub downloads, according to the available data) and Abstracts Views on Vision4Press platform.
Data correspond to usage on the plateform after 2015. The current usage metrics is available 48-96 hours after online publication and is updated daily on week days.
Initial download of the metrics may take a while.