Fig. 7
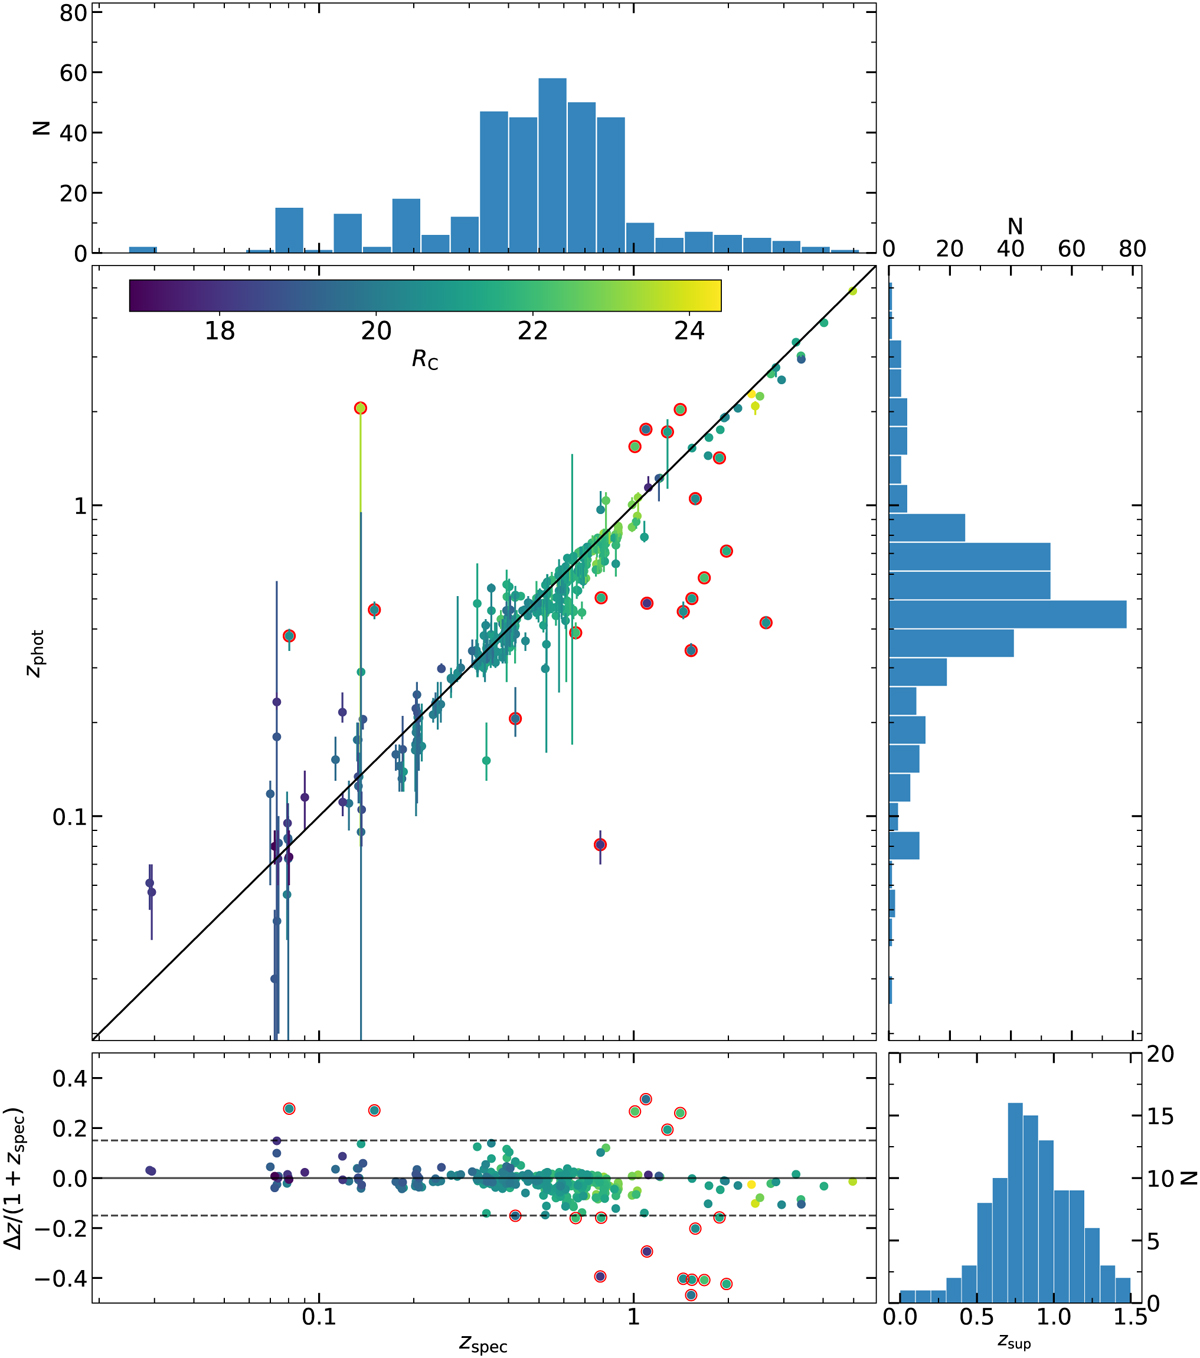
Download original image
Comparison between the photometric redshifts from FT12 and the spectroscopic redshifts measured in this study. The error bars in zphot represent the range of 90% significance. The error bars in zspec are not appreciable, and the median value is 3 × 10⁻⁴. The colour code represents the RC magnitude. In the bottom left panel, the difference between zphot and zspec divided by zspec against zspec is plotted. Dashed lines represent the limit in the outlier definition (see Sect. 6.1) and empty red circles represent the outliers. Because of the scale of the ordinate axis, there are points beyond the range of visualization. In the bottom right panel, the distribution of zsup is shown.
Current usage metrics show cumulative count of Article Views (full-text article views including HTML views, PDF and ePub downloads, according to the available data) and Abstracts Views on Vision4Press platform.
Data correspond to usage on the plateform after 2015. The current usage metrics is available 48-96 hours after online publication and is updated daily on week days.
Initial download of the metrics may take a while.