Fig. 5
Download original image
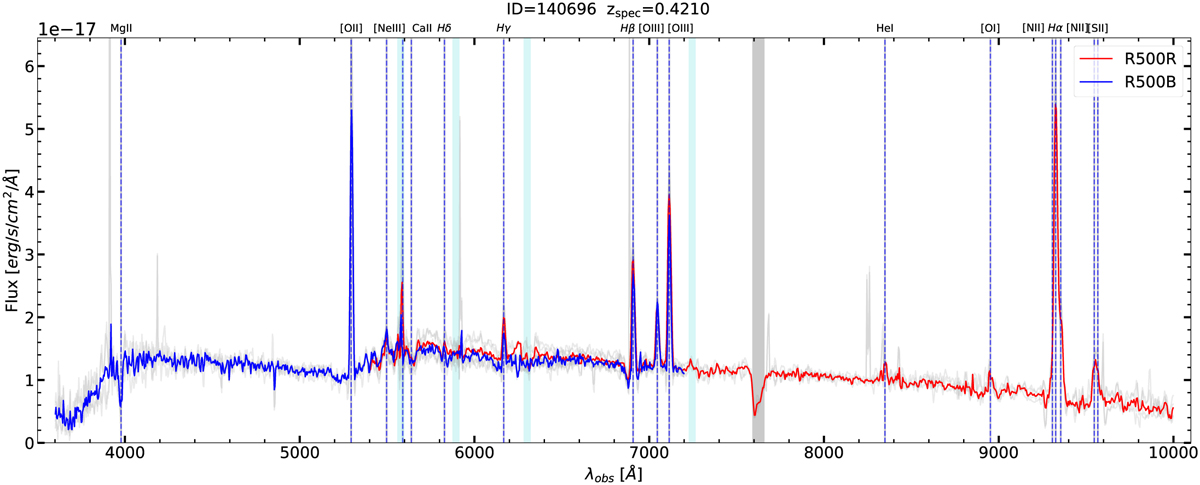
Final ID spectrum for an SFG in the faint subset at a spectroscopic redshift, zspec = 0.421. Blue and red lines are the final spectra for the R500B and R500R grisms, respectively. Individual observations with the grisms are plotted in grey, where some residuals of sky emission or cosmic ray detection are visible, but not in the final spectra owing to the application of the ‘average-sigma-clipping’ algorithm. The vertical dashed blue lines mark the most prominent spectral features in this wavelength range at that redshift. The vertical cyan bands show the areas where sky emission is most important, and the wider grey band corresponds to the telluric absorption band.
Current usage metrics show cumulative count of Article Views (full-text article views including HTML views, PDF and ePub downloads, according to the available data) and Abstracts Views on Vision4Press platform.
Data correspond to usage on the plateform after 2015. The current usage metrics is available 48-96 hours after online publication and is updated daily on week days.
Initial download of the metrics may take a while.