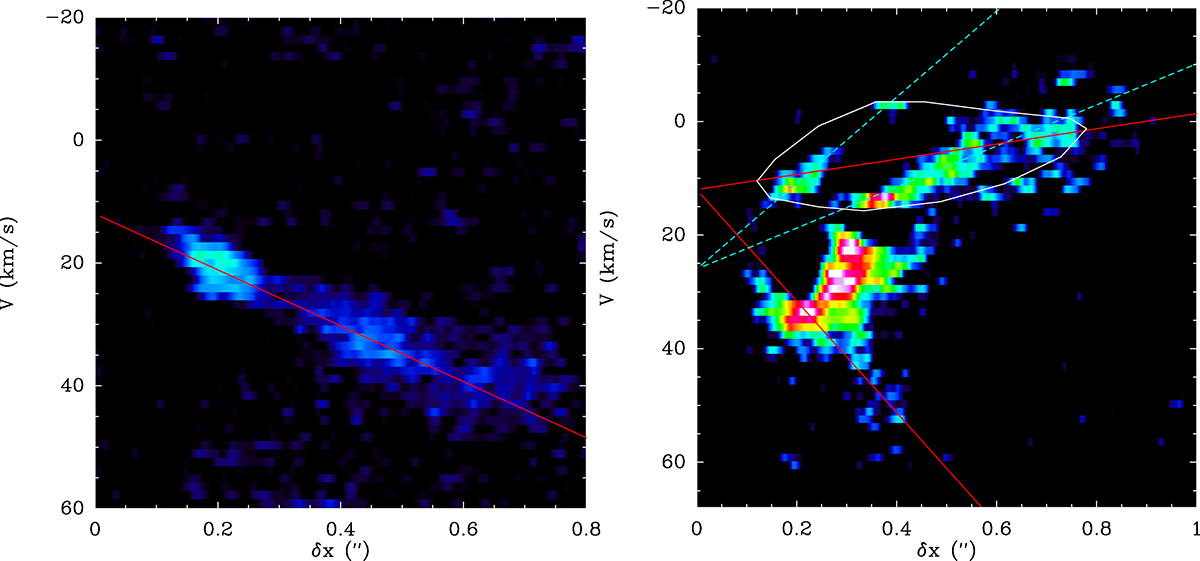
Fig. 3.
Download original image
Position-velocity diagrams obtained for H2S 22, 0–21, 1 along different directions. Left: PV obtained for H2S 22, 0–21, 1 emission along the line connecting VY and C. The red line corresponds to a linear jet with an inclination of 15° with respect to the plane of the sky and ![]() and VLRS = 12 km s−1. Right: PV obtained for the same transition along the line connecting VY and A. The red lines correspond to the same velocity field as in the left panel and an inclination with respect to the plane of the sky of 4.5° for the upper jet and 30° for the lower jet (see red lines). The white line surrounds the suggested structure of the northern jet (see text). The cyan line corresponds to VLRS = 26 km s−1 (see text).
and VLRS = 12 km s−1. Right: PV obtained for the same transition along the line connecting VY and A. The red lines correspond to the same velocity field as in the left panel and an inclination with respect to the plane of the sky of 4.5° for the upper jet and 30° for the lower jet (see red lines). The white line surrounds the suggested structure of the northern jet (see text). The cyan line corresponds to VLRS = 26 km s−1 (see text).
Current usage metrics show cumulative count of Article Views (full-text article views including HTML views, PDF and ePub downloads, according to the available data) and Abstracts Views on Vision4Press platform.
Data correspond to usage on the plateform after 2015. The current usage metrics is available 48-96 hours after online publication and is updated daily on week days.
Initial download of the metrics may take a while.