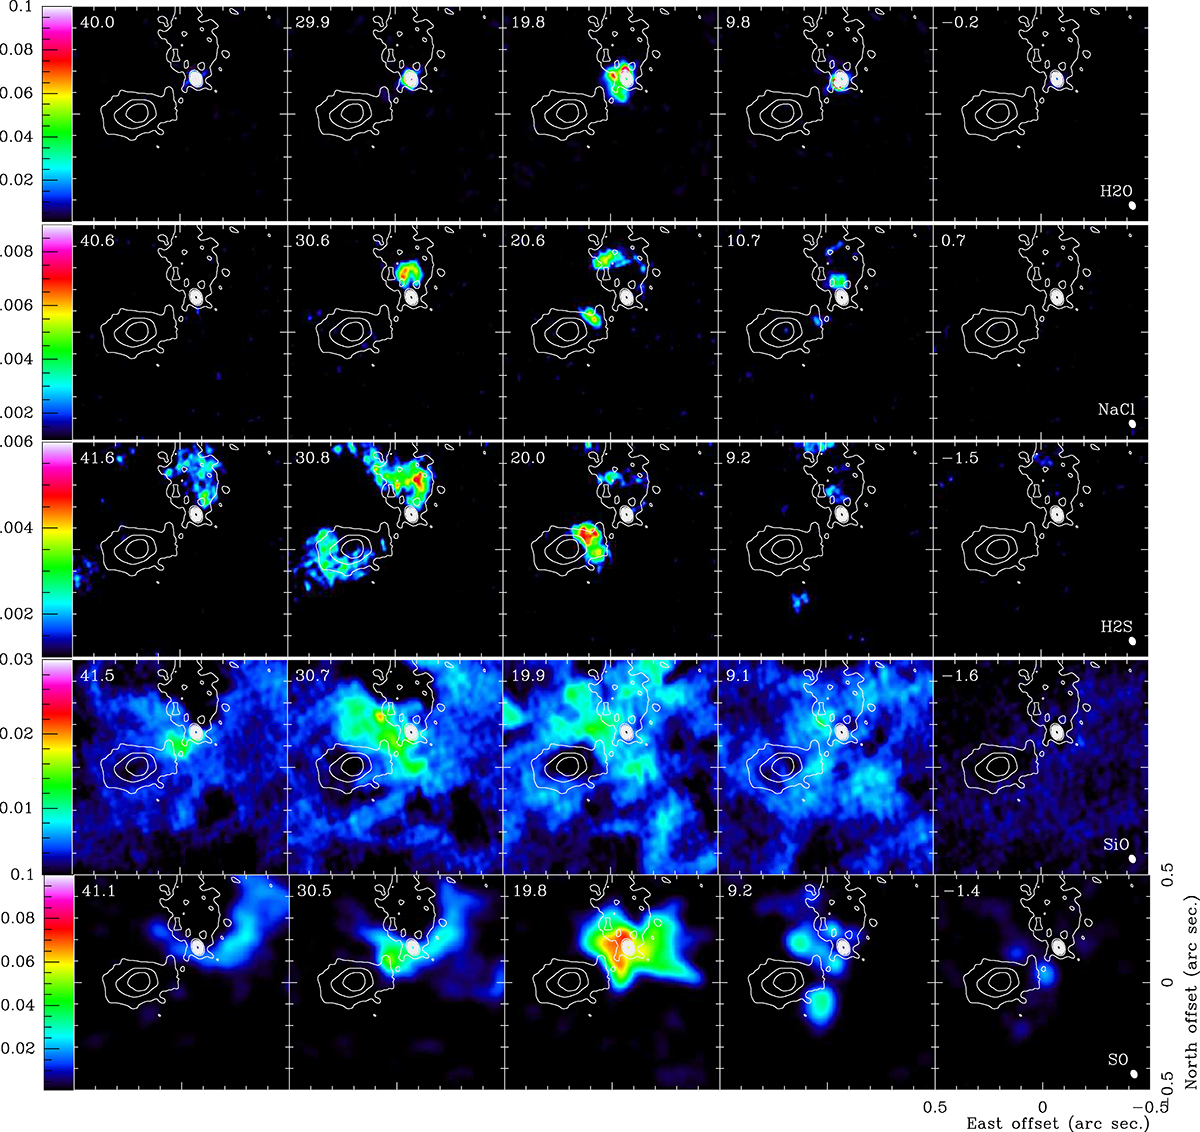
Fig. 2.
Download original image
Channel maps of some lines showing the complexity of VY CMa ejecta (continuum shown in contours). From top to bottom in color: H2O v = 2 55, 0 − 64, 3; NaCl 18–17; H2S 22, 0–21, 1 SiO 5–4; SO 56 − 45. The value of VLSR of each panel is shown in the upper left corner. The HPBW is ![]() with a PA of 29° (see the bottom right corner of the last panel). The continuum emission is shown in white contours.
with a PA of 29° (see the bottom right corner of the last panel). The continuum emission is shown in white contours.
Current usage metrics show cumulative count of Article Views (full-text article views including HTML views, PDF and ePub downloads, according to the available data) and Abstracts Views on Vision4Press platform.
Data correspond to usage on the plateform after 2015. The current usage metrics is available 48-96 hours after online publication and is updated daily on week days.
Initial download of the metrics may take a while.